jcdd

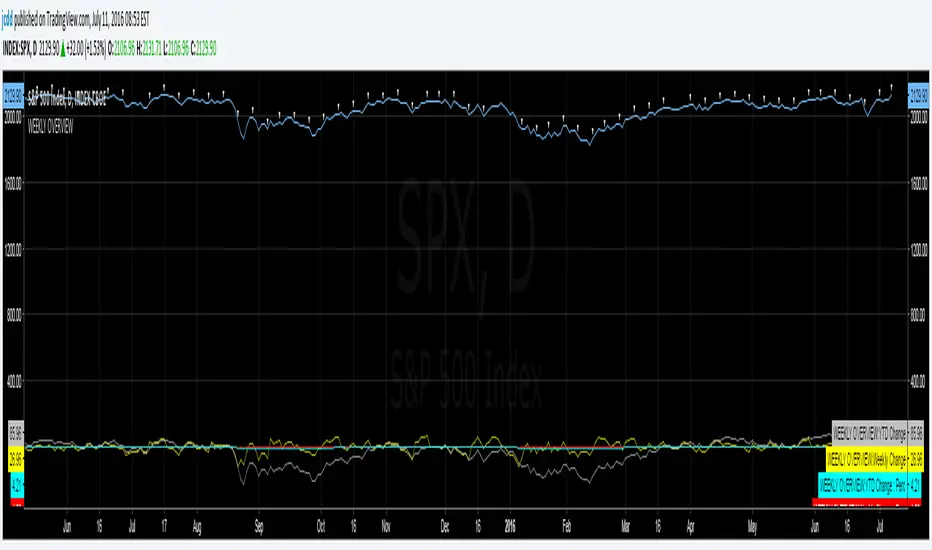
WEEKLY OVERVIEW

38
Weekly change from friday to friday & YTD change. Compensates for missing Fridays.
開源腳本

本著真正的TradingView精神,該腳本的作者將其開源發布,以便交易者可以理解和驗證它。為作者喝彩吧!您可以免費使用它,但在出版物中重複使用此代碼受網站規則的約束。 您可以收藏它以在圖表上使用。

免責聲明

這些資訊和出版物並不意味著也不構成TradingView提供或認可的金融、投資、交易或其他類型的意見或建議。請在使用條款閱讀更多資訊。

想在圖表上使用此腳本?
study('WEEKLY OVERVIEW', overlay=true, max_bars_back=1000)


//WEEKLY CHANGE\\

friday_dist = barssince(dayofweek == 6)
//correct for fridays having 0 distance
dist_2 = iff(dayofweek == 6, friday_dist[1]+1, friday_dist)
//correct for missing fridays
thurs_dist = barssince(dayofweek == 4)
dist_3 = iff(dist_2 > 5, thurs_dist, dist_2)
//correct for thursday low distance
dist_4 = iff(dist_3 == 0, thurs_dist[1]+1, dist_3)
//correct for monday offset
dist_5 = iff(dist_4 == 5 and dayofweek == 1, thurs_dist, dist_4)
//correct for friday low distance
dist_6 = iff(dist_5 == 1 and dayofweek == 5, dist_5[1]+1, dist_5)

weekchg = close - close[dist_6]
weekchgp = (weekchg/close[dist_6])*100

plot(weekchg, "Weekly Change", color=yellow)
plot(weekchgp, "Weekly Change : Perc", color=red)

//YEAR TO DATE CHANGE\\

year_dist = barssince(weekofyear == 52)
//correct for final week in year
ydist_2 = iff(weekofyear == 52 and dayofmonth != 1, barssince(weekofyear == 52)[dayofweek]+dayofweek, year_dist)

yrchg = close - close[ydist_2]
yrchgp = (yrchg/close[ydist_2])*100

plot(yrchg, "YTD Change", color=silver)
plot(yrchgp, "YTD Change : Perc", color=aqua)


//OTHER STUFF\\
plotshape(dayofweek == 6, style = shape.triangledown, title= "Friday Marker", color=white)
//plotshape(highest(close,ydist_2), style = shape.labelup, text = "Current Year High")
//plotshape(lowest(close,ydist_2), style = shape.labelup, text = "Current Year Low")