OPEN-SOURCE SCRIPT
BUY/SELL SIGNALS from LSMA/ALMA/HMA
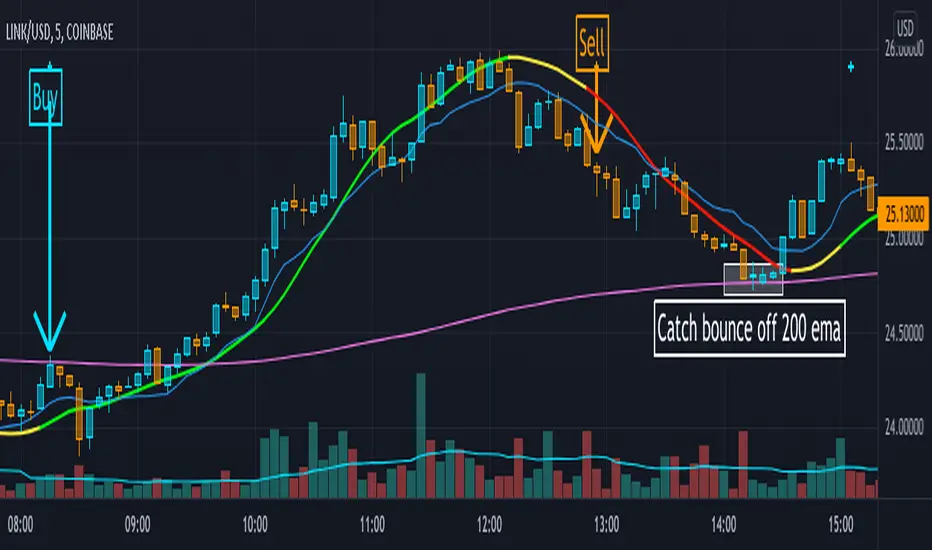
This indicator uses the Least Squares Moving Average (LSMA) in tandem with the Arnaud Legoux Moving Average (ALMA) and Hull Moving Average (HMA) to generate buy-sell signals, represented by the light blue and orange crosses respectively.
The yellow lines produced by the indicator show periods of market uncertainty and possible reversal, and a modified, user-defined VWAP is given along with a 200 EMA. The point of this indicator was to create a smoother, more visually appealing moving-average, price action-based indicator when compared to the trend-step and simple moving average indicators available. This indicator uses a fast (25 period) LSMA coupled with a slower (50 period) HMA and ALMA in order to make signals both smooth and fast.
This indicator will work on all markets, except the modified VWAP will naturally not function if the volume is unpublished for that market. Use of this indicator will be very strong in trending markets, as the yellow line will spot possible reversals quite early, meaning the trader can be ready early for the buy/sell signal to appear. Use of this indicator in sideways market conditions will be limited, as it is for all moving average-based indicators, but the damage will be minimal as bad trades will be quickly realized by the indicator and the color will switch to yellow, this is possible because of the settings differences between the period lengths of the LSMA vs the ALMA + HMA.
開源腳本
本著TradingView的真正精神,此腳本的創建者將其開源,以便交易者可以查看和驗證其功能。向作者致敬!雖然您可以免費使用它,但請記住,重新發佈程式碼必須遵守我們的網站規則。
免責聲明
這些資訊和出版物並不意味著也不構成TradingView提供或認可的金融、投資、交易或其他類型的意見或建議。請在使用條款閱讀更多資訊。
開源腳本
本著TradingView的真正精神,此腳本的創建者將其開源,以便交易者可以查看和驗證其功能。向作者致敬!雖然您可以免費使用它,但請記住,重新發佈程式碼必須遵守我們的網站規則。
免責聲明
這些資訊和出版物並不意味著也不構成TradingView提供或認可的金融、投資、交易或其他類型的意見或建議。請在使用條款閱讀更多資訊。