OPEN-SOURCE SCRIPT
已更新 MrBS:EMA/SMA/HMA (Heikin Ashi Calc)
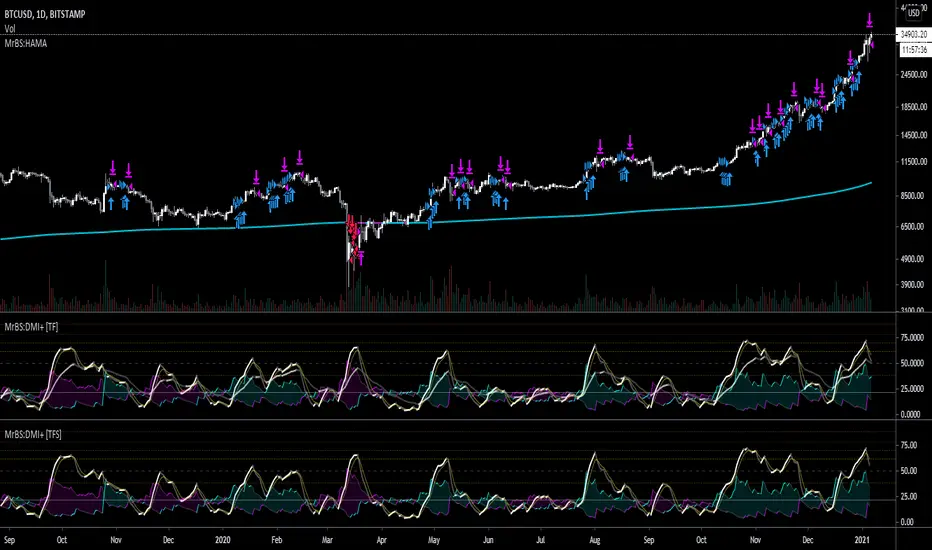
This indicator allows you to base the MA calculation from Heikin Ashi values on normal charts and/or the real OHLC values while looking at Heikin Ashi.
There are 3 MA types you can select - EMA / SMA / HMA
The colour is based on the slope.
I made this to help me visualize my DMI+ strategy, when I was looking at taking signals from Heikin Ashi but looking at candlesticks. Turns out, I was going down the wrong road. Now I'm looking into using the real OHLC values for generating signals but watching the Heikin Ashi chart as I find it easier to see trends on it.
Hopefully its useful to some people, and if you have any suggestions for improvements I'd love to know.
發行說明
Minor Update to make it line up with the Trend Friend Strategy update I am about to upload. I have changed it so instead of being an overlay, it will plot the DMI and ADX in a pane, so now we need the MA filter to be a separate indicator that can be overlaid. 開源腳本
秉持TradingView一貫精神,這個腳本的創作者將其設為開源,以便交易者檢視並驗證其功能。向作者致敬!您可以免費使用此腳本,但請注意,重新發佈代碼需遵守我們的社群規範。
免責聲明
這些資訊和出版物並非旨在提供,也不構成TradingView提供或認可的任何形式的財務、投資、交易或其他類型的建議或推薦。請閱讀使用條款以了解更多資訊。
開源腳本
秉持TradingView一貫精神,這個腳本的創作者將其設為開源,以便交易者檢視並驗證其功能。向作者致敬!您可以免費使用此腳本,但請注意,重新發佈代碼需遵守我們的社群規範。
免責聲明
這些資訊和出版物並非旨在提供,也不構成TradingView提供或認可的任何形式的財務、投資、交易或其他類型的建議或推薦。請閱讀使用條款以了解更多資訊。