Multi TF Oscillators Screener [TradingFinder] RSI / ATR / Stoch🔵 Introduction
The oscillator screener is designed to simplify multi-timeframe analysis by allowing traders and analysts to monitor one or multiple symbols across their preferred timeframes—all at the same time. Users can track a single symbol through various timeframes simultaneously or follow multiple symbols in selected intervals. This flexibility makes the tool highly effective for analyzing diverse markets concurrently.
At the core of this screener lie two essential oscillators: RSI (Relative Strength Index) and the Stochastic Oscillator. The RSI measures the speed and magnitude of recent price movements and helps identify overbought or oversold conditions.
It's one of the most reliable indicators for spotting potential reversals. The Stochastic Oscillator, on the other hand, compares the current price to recent highs and lows to detect momentum strength and potential trend shifts. It’s especially effective in identifying divergences and short-term reversal signals.
In addition to these two primary indicators, the screener also displays helpful supplementary data such as the dominant candlestick type (Bullish, Bearish, or Doji), market volatility indicators like ATR and TR, and the four key OHLC prices (Open, High, Low, Close) for each symbol and timeframe. This combination of data gives users a comprehensive technical view and allows for quick, side-by-side comparison of symbols and timeframes.
🔵 How to Use
This tool is built for users who want to view the behavior of a single symbol across several timeframes simultaneously. Instead of jumping between charts, users can quickly grasp the state of a symbol like gold or Bitcoin across the 15-minute, 1-hour, and daily timeframes at a glance. This is particularly useful for traders who rely on multi-timeframe confirmation to strengthen their analysis and decision-making.
The tool also supports simultaneous monitoring of multiple symbols. Users can select and track various assets based on the timeframes that matter most to them. For example, if you’re looking for entry opportunities, the screener allows you to compare setups across several markets side by side—making it easier to choose the most favorable trade. Whether you’re a scalper focused on low timeframes or a swing trader using higher ones, the tool adapts to your workflow.
The screener utilizes the widely-used RSI indicator, which ranges from 0 to 100 and highlights market exhaustion levels. Readings above 70 typically indicate potential pullbacks, while values below 30 may suggest bullish reversals. Viewing RSI across timeframes can reveal meaningful divergences or alignments that improve signal quality.
Another key indicator in the screener is the Stochastic Oscillator, which analyzes the closing price relative to its recent high-low range. When the %K and %D lines converge and cross within the overbought or oversold zones, it often signals a momentum reversal. This oscillator is especially responsive in lower timeframes, making it ideal for spotting quick entries or exits.
Beyond these oscillators, the table includes other valuable data such as candlestick type (bullish, bearish, or doji), volatility measures like ATR and TR, and complete OHLC pricing. This layered approach helps users understand both market momentum and structure at a glance.
Ultimately, this screener allows analysts and traders to gain a full market overview with just one look—empowering faster, more informed, and lower-risk decision-making. It not only saves time but also enhances the precision and clarity of technical analysis.
🔵 Settings
🟣 Display Settings
Table Size : Lets you adjust the table’s visual size with options such as: auto, tiny, small, normal, large, huge.
Table Position : Sets the screen location of the table. Choose from 9 possible positions, combining vertical (top, middle, bottom) and horizontal (left, center, right) alignments.
🟣 Symbol Settings
Each of the 10 symbol slots comes with a full set of customizable parameters :
Enable Symbol : A checkbox to activate or hide each symbol from the table.
Symbol : Define or select the asset (e.g., XAUUSD, BTCUSD, EURUSD, etc.).
Timeframe : Set your desired timeframe for each symbol (e.g., 15, 60, 240, 1D).
RSI Length : Defines the period used in RSI calculation (default is 14).
Stochastic Length : Sets the period for the Stochastic Oscillator.
ATR Length : Sets the length used to calculate the Average True Range, a key volatility metric.
🔵 Conclusion
By combining powerful oscillators like RSI and Stochastic with full customization over symbols and timeframes, this tool provides a fast, flexible solution for technical analysts. Users can instantly monitor one or several assets across multiple timeframes without opening separate charts.
Individual configuration for each symbol, along with the inclusion of key metrics like candlestick type, ATR/TR, and OHLC prices, makes the tool suitable for a wide range of trading styles—from scalping to swing and position trading.
In summary, this screener enables traders to gain a clear, high-level view of various markets in seconds and make quicker, smarter, and lower-risk decisions. It saves time, streamlines analysis, and boosts overall efficiency and confidence in trading strategies.
Ohlc

Candle Range Trading (CRT) with Alerts
📌 Description:
The Candle Range Trading (CRT) indicator identifies potential reversal or continuation setups based on specific two-candle price action patterns.
It analyzes pairs of candles to detect Bullish or Bearish CRT patterns and provides visual signals (triangles) and alert notifications to support scalp or swing trading strategies.
🔍 How It Works:
🔻 Bearish CRT Pattern:
Candle 1 is bullish
Candle 2 is bearish
Candle 2's high > Candle 1's high
Candle 2 closes within Candle 1’s range
🔺 Red triangle above candle
🔺 Bullish CRT Pattern:
Candle 1 is bearish
Candle 2 is bullish
Candle 2's low < Candle 1's low
Candle 2 closes within Candle 1’s range
🔻 Green triangle below candle
📈 Visual Features:
🔺 Red triangle = Bearish CRT
🔻 Green triangle = Bullish CRT
📏 Optional box showing CRT High and CRT Low
🔔 Built-in Alerts:
Bullish CRT Alert: "Bullish CRT Pattern Detected"
Bearish CRT Alert: "Bearish CRT Pattern Detected"
Set alerts to get notified instantly when a pattern is detected.
⚠️ Note:
Use in conjunction with trend filters, support/resistance, or volume for best results.
Ideal for scalping or short-term trades.
Avoid trading in choppy or low-volume markets.
⚠️ Disclaimer:
This script was generated with the assistance of ChatGPT by OpenAI and is intended for educational and informational purposes only.
All strategies, alerts, and signals derived from this indicator should be thoroughly backtested and validated before using in live trading.
Trading involves substantial risk, and past performance is not indicative of future results. The author and ChatGPT bear no responsibility for any trading losses or financial decisions made using this script.
Users are solely responsible for the risks associated with their trading actions. Always apply proper risk management and perform your own due diligence before making any financial decisions.

Clean OHLC Lines | BaksPlots clean, non-repainting OHLC lines from higher timeframes onto your chart. Ideal for tracking key price levels (open, high, low, close) with precision and minimal clutter.
Core Functionality
Clean OHLC Lines = Historical Levels + Non-Repainting Logic
• Uses lookahead=on to anchor historical lines, ensuring no repainting.
• Displays OHLC lines for customizable timeframes (15min to Monthly).
• Optional candlestick boxes for visual context.
Key Features
• Multi-Timeframe OHLC:
Plot lines from 15min, 30min, 1H, 4H, Daily, Weekly, or Monthly timeframes.
• Non-Repainting Logic:
Historical lines remain static and never recalculate.
• Customizable Styles:
Adjust colors, line widths (1px-4px), and transparency for high/low/open/close lines.
• Candle Display:
Toggle candlestick boxes with bull/bear colors and adjustable borders.
• Past Lines Limit:
Control how many historical lines are displayed (1-500 bars).
User Inputs
• Timeframe:
Select the OHLC timeframe (e.g., "D" for daily).
• # Past Lines:
Limit historical lines to avoid overcrowding (default: 10).
• H/L Mode:
Draw high/low lines from the current or previous period.
• O/C Mode:
Anchor open/close lines to today’s open or yesterday’s close.
• Line Styles:
Customize colors, transparency, and styles (solid/dotted/dashed).
• Candle Display:
Toggle boxes/wicks and adjust bull/bear colors.
Important Notes
⚠️ Alignment:
• Monthly/weekly timeframes use fixed approximations (30d/7d).
• For accuracy, ensure your chart’s timeframe ≤ the selected OHLC timeframe (e.g., use 1H chart for daily lines).
⚠️ Performance:
• Reduce # Past Lines on low-end devices for smoother performance.
Risk Disclaimer
Trading involves risk. OHLC lines reflect historical price levels and do not predict future behavior. Use with other tools and risk management.
Open-Source Notice
This script is open-source under the Mozilla Public License 2.0. Modify or improve it freely, but republishing must follow TradingView’s House Rules.
📈 Happy trading!

Vortex Candle MarkerVortex Candle Marker
The Vortex Candle Marker is a specialized TradingView indicator designed to identify and highlight **Vortex Candles**—candles that momentarily form without wicks on either the high or low. This unique price behavior can signal potential price retracements or reversals, aligning with the **Power of Three (PO3)** concept in price action theory.
Indicator Logic:
A candle is classified as a **Vortex Candle** if either of these conditions is met during its formation:
1. **Vortex Top:** The **high** equals either the **open** or **close**, indicating no upper wick.
2. **Vortex Bottom:** The **low** equals either the **open** or **close**, indicating no lower wick.
When a Vortex Candle is detected, the indicator changes the **candle border color** to **aqua**, making it easy to identify these significant price moments.
Market Insight & PO3 Interpretation:
In typical price behavior, most candles exhibit both upper and lower wicks, representing price exploration before settling at a closing value. A candle forming without a wick suggests **strong directional intent** at that moment. However, by the **Power of Three (PO3)** concept—Accumulation, Manipulation, and Distribution—such wickless formations often imply:
- **Price Reversion Likelihood:** When a candle temporarily forms without a wick, it suggests the market may **revisit the opening price** to establish a wick before the candle closes.
- **Liquidity Manipulation:** The absence of a wick may indicate a **stop-hunt** or liquidity grab, where the price manipulates one side before reversing.
- **Entry Triggers:** Identifying these moments can help traders anticipate potential **retracements** or **continuations** within the PO3 framework.
Practical Application
- **Early Reversal Detection:** Spot potential price reversals by observing wickless candles forming at key levels.
- **Breakout Validation:** Use Vortex Candles to confirm **true breakouts** or **false moves** before the price returns.
- **Liquidity Zones:** Identify areas where the market is likely to revisit to create a wick, signaling entry/exit points.
This indicator is a powerful tool for traders applying **Po3** methodologies and seeking to capture price manipulation patterns.

Previous Key Levels (fadi)Previous Key Levels indicator is a highly configurable OHLC levels tool designed to provide traders with the ability to plot multiple levels while minimizing screen clutter. This indicator is perfect for those who want to monitor various timeframes simultaneously without overloading their charts with unnecessary information.
How to Use It
This indicator offers traders the flexibility to track up to 6 higher timeframes (HTFs) and multiple candles for each timeframe. For example, a trader can choose to monitor the OHLC of the last four 4-hour candles, providing a comprehensive view of significant price levels over different periods.
Key Features
Highly Configurable: Customize the number of timeframes and candles to suit your trading strategy.
Minimal Screen Clutter: Efficiently plot multiple levels without overwhelming your chart.
Flexible Application: Ideal for identifying support and resistance levels, liquidity sweeps, target levels, and more, adapting to various trading styles.
Traders have diverse trading styles and preferences. Some may use these levels to identify support and resistance zones, while others might look for liquidity sweeps or set target levels. By offering a high degree of customization, the Previous Key Levels indicator caters to the unique needs of individual traders, helping them make informed decisions based on historical price action across multiple timeframes.
Timeframe Settings
Toggle to track 6 HTF settings and the number of candles to track for each.
Limit to next HTFs only can be used to limit the HTF levels displayed based on the current timeframe.
Hide Above will disable the indicator above the specified interval.
Offset to Left and Right are used to specify where the level line starts and ends based on the current candle.
Offset between HTFs extends HTF levels to become more readable.
HTF Settings
Choice of the OHLC levels to track.
Specify the color, line style, and line width for each level.
Mark the start of that level, for example, draw a vertical line where the 4H candle has started.
Trace back to draw optional lines to track back to the origin of the level.
Label Settings
Highly configurable labels that allow traders to customize the labels to their liking.
Label color, background, and size.
Customize using up to 9 configurable parts.
Fading Levels
To prevent clutter, the indicator offers the option to change the transparency of the levels based on their distance from the current price. The distance is calculated based on a configurable Average True Range (ATR).
Change Transparency to a percentage of its current color.
Range should be within X candles will fade any level that is X candles length away from the current price.
ATR length used in calculation will calculate the average size of candles in the calculation.

Weekly OHLC LevelsWeekly OHLC Levels Indicator
This indicator plots the previous week's open, high, low, and close (OHLC) levels on the chart for the entire duration of the current week. These levels can be critical for identifying key support and resistance zones, as they often represent psychological levels that traders watch closely.
Features:
Plots previous week’s High (green), Low (red), Open (blue), and Close (purple).
Levels remain visible throughout the current week, providing consistent reference points.
Helps in visualizing how current price action interacts with last week’s important levels.
How to Use:
Use these levels to gauge potential support and resistance areas.
Monitor price reactions around these levels, especially during the beginning of the week, as they can serve as pivot points.
This indicator is suitable for all markets and timeframes, providing valuable insight into price structure relative to weekly market behavior.

Last Candle OHLC (Ticks or Points)What the Code Does
1. **Draws Lines and Labels**:
- It draws lines on your chart to show the high, low, open, and close prices from the previous period (like the previous day or week).
- It also labels these lines with numbers that tell you how far the current price is from these levels.
2. **Shows Price Movement**:
- You can see how far the price has moved from these levels in terms of small price changes (ticks) or larger units (points).
- This helps you understand price movements and potential levels of support or resistance.
3. **Customizable**:
- You can choose whether to show these lines and labels, and you can select if you want to see the movement in ticks or points.
- The lines can extend into the future on your chart to help you anticipate where prices might be in the coming days.
### How It’s Useful:
1. **Identify Key Levels**:
- It helps you spot important price levels from past periods, which can act as support or resistance.
2. **Understand Price Movement**:
- You get a visual sense of how much the price has moved from key levels, which can help you gauge market volatility.
3. **Plan Trades**:
- By seeing where the price has been and how it has moved, you can better plan your trades, like deciding where to enter or exit based on these levels.
4. **Flexible for Different Markets**:
- It works across various markets, like stocks, futures, and forex, adjusting to the specific characteristics of each instrument.
In short, this tool helps you visualize and understand past price movements and levels on your chart, aiding in your trading decisions.

Candle Color By OHLC ComparisonThis indicator is designed to help you recognize the price movements within a candle/bar more quickly and easily. Typically, candle coloring is based on the opening and closing prices, but in this indicator, I followed the OHLC values in reverse order: starting with closing, low, high, and then opening. Each of these is compared with the value in the previous candle. I assigned the least importance to the opening, hence did not include it in the color determination. To make the colors memorable, I used a rainbow-like color scale; with purple representing the highest value and maroon the lowest. You can also change the colors if you wish. Additionally, if you want to set alarms, I assigned values to the candles; the highest being 16 and the lowest 1. A thicker barchart provides a better visual representation.
For instance, consider the monthly chart of the NASDAQ 100. After a prolonged positive trend, when our indicator shows a negative maroon bar (representing a low value) for the first time, it could signal a change in the trend direction. In this scenario, the appearance of the maroon bar serves as a crucial alert for investors to review their current positions or prepare for a potential downtrend. This indicator provides users with a significant advantage in identifying such critical turning points and assists them in quickly adapting to market dynamics.

OHMLC Lines - Present- Current OHMLC candles
- Show current Open, High, Mid, Low, Close candles levels

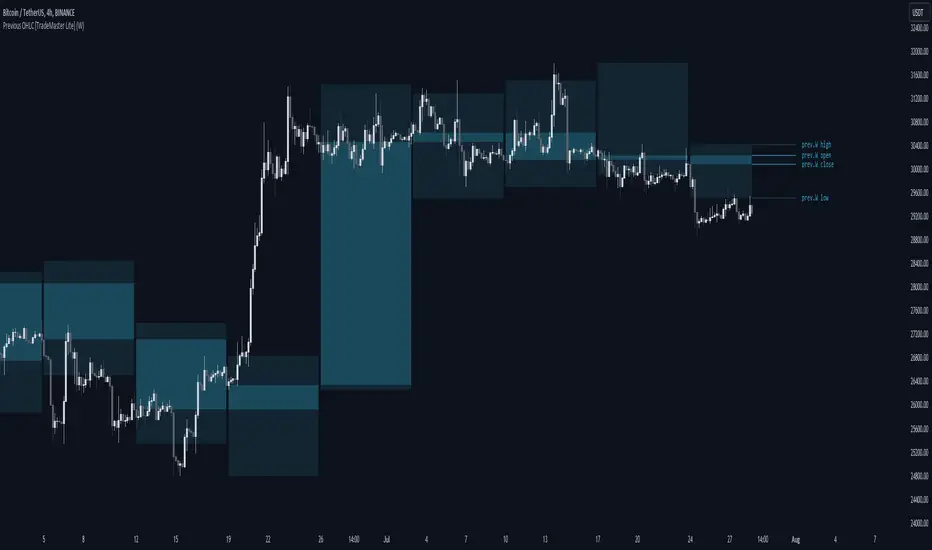
Previous OHLC Levels [TradeMaster Lite]In trading, the “Previous Open/High/Low/Close” (or previous OHLC) refers to the opening, high, low and closing price of the instrument in the previous period. These prices are typically used in technical analysis to identify trends and patterns and to make trading decisions. Some traders may also use the differences between the opening, high, low and closing prices to make trading decisions. For example, the difference between the closing and opening price (the so-called “true body”) and the high and low price (the so-called “upper shadow” and “lower shadow”) can indicate the strength of a trend, whether the bulls or bears are controlling the market, and can also give an idea of market volatility, and are also used as support and resistance levels.
Previous Open: shows the opening price of the previous period. It's the price at which the market first started trading in that period.
Previous High: represents the highest price reached during the previous period. It can act as a resistance level for the current period.
Previous Low: indicates the lowest price hit during the previous period. It can serve as a support level in the current period.
Previous Close: the last price at which the asset traded during the previous period. It's often considered the most accurate reflection of the market sentiment at the end of that period.
These values provide a summary of the previous trading period's price action, giving you a baseline for comparing current price movements. They can help in understanding the market's direction and identifying potential support and resistance levels. It is important to keep in mind that, like any other technical indicator, Previous OHLC does not give a definitive indication of future market direction and should be used in conjunction with other analytical tools, as well as fundamental analysis and market sentiment. It is also important to have appropriate risk management in place.
👉 General advice
Confirming Signals with other indicators:
As with all technical indicators, it is important to confirm potential signals with other analytical tools, such as support and resistance levels, as well as indicators like RSI, MACD, and volume. This helps increase the probability of a successful trade.
Use proper risk management:
When using this or any other indicator, it is crucial to have proper risk management in place. Consider implementing stop-loss levels and thoughtful position sizing.
Combining with other technical indicators:
The indicator can be effectively used alongside other technical indicators to create a comprehensive trading strategy and provide additional confirmation.
Keep in Mind:
Thorough research and backtesting are essential before making any trading decisions. Furthermore, it's crucial to have a solid understanding of the indicator and its behavior. Additionally, incorporating fundamental analysis and considering market sentiment can be vital factors to take into account in your trading approach.
Limitations:
This is a lagging indicator. Please note that the displayed values are delayed by the chosen timeframe on historical bars and show the values from the previous period on the current bar.
The indicators within the TradeMaster Lite package aim for simplicity and efficiency, while retaining their original purpose and value. Some settings, functions or visuals may be simpler than expected.
⭐ Conclusion
We hold the view that the true path to success is the synergy between the trader and the tool, contrary to the common belief that the tool itself is the sole determinant of profitability. The actual scenario is more nuanced than such an oversimplification. Our aim is to offer useful features that meet the needs of the 21st century and that we actually use.
🛑 Risk Notice:
Everything provided by trademasterindicator – from scripts, tools, and articles to educational materials – is intended solely for educational and informational purposes. Past performance does not assure future returns.
luckynickva OHLC
This Script Shows The OHLC Of The Higher Timeframe Candles In The Background Great For Not Losing Sight Of The Bigger Picture On The Lower Timeframe
ICT Day/Week/Month Levels [MK]Displays Open, High, Low, Close and 50% levels for the Previous Day/Week/Month.
Also shows the Open for the Current Day/Week/Month
Also shows the Current New Week Opening Gap Midline (NWOG)
These levels are key to teachings by ICT as well as other trading strategies. There are lots of scripts available for this data, however this one plots the levels to the right of price on the chart to keep the chart as clean as possible. The line styles, colors and text can be customised. The offset to the right of the chart for the start of line and label offsets can also be adjusted.
Labels are abbreviated to PDH (previous day high), CMO (current month open), PW50% (previous week 50% from high to low) ..etc
OHLC📕 LIBRARY OHLC
🔷 Introduction
This library is a custom library designed to work with real-time bars. It allows to easily calculate OHLC values for any source.
Personally, I use this library to accurately display the highest and lowest values on visual indicators such as my progress bars.
🔷 How to Use
◼ 1. Import the OHLC library into your TradingView script:
import cryptolinx/OHLC/1
- or -
Instead of the library namespace, you can define a custom namespace as alias.
import cryptolinx/OHLC/1 as src
◼ 2. Create a new OHLC source using the `new()` function.
varip mySrc = OHLC.new() // It is required to use the `varip` keyword to init your ``
- or -
If you has set up an alias before.
varip mySrc = src.new()
===
In that case, your `` needs to be `na`, define your object like that
varip mySrc = na
◼ 3. Call the `hydrateOHLC()` method on your OHLC source to update its values:
Basic
float rsi = ta.rsi(close, 14)
mySrc.hydrateOHLC(rsi)
- or -
Inline
rsi = ta.rsi(close, 14).hydrateOHLC(mySrc)
◼ 4. The data is accessible under their corresponding names.
mySrc.open
mySrc.high
mySrc.low
mySrc.close
🔷 Note: This library only works with real-time bars and will not work with historical bars.

Bursa Malaysia Index SeriesERVIEW
This indicator is intend to display Bursa Malaysia Index Series.
█ FEATURES
1. Choose available sector based on Bursa Malaysia Index.
2. Plot close or OHLC.
3. Color of Closing price plot adapt to chart background color.
4. Font size can be selected.
█ EXAMPLES / USAGES

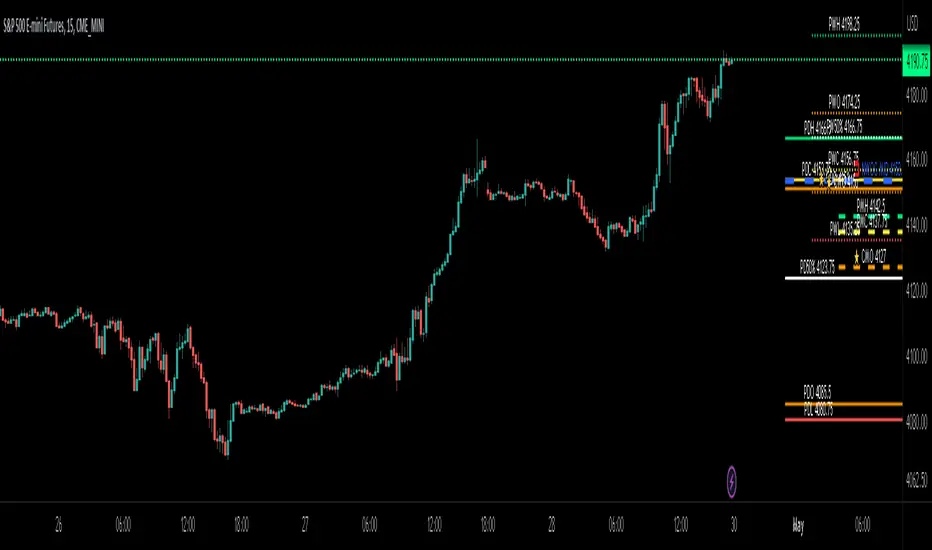
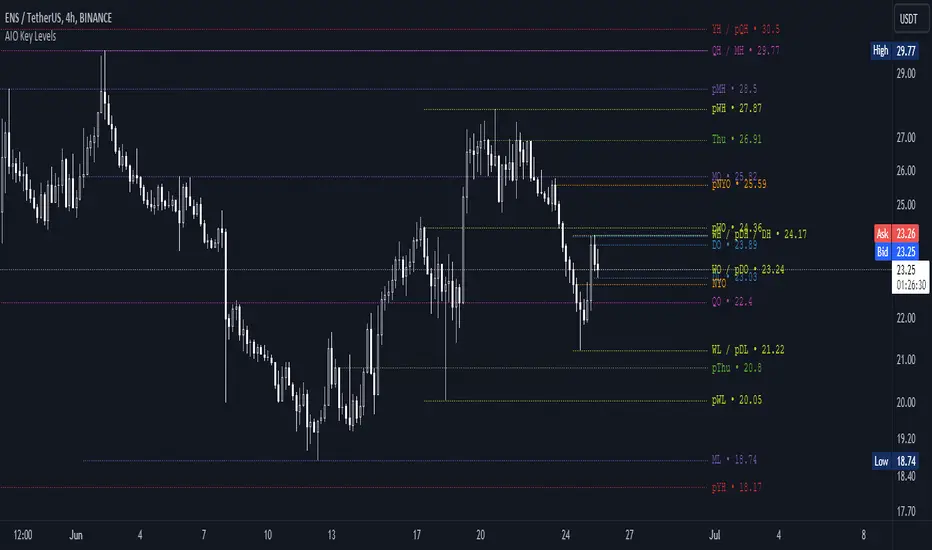
AIO Key LevelsAll In One Key Levels - Displays key levels for any type of chart.
Over 30 levels at your complete disposal.
Filled with a host of features that allow you to customise the appearance and display of the indicator to suit your individual trading style.
The result is a clear and concise indicator that helps traders easily identify key levels.
- The indicator is easy to use and does not need a detailed description.
- With customisable input parameters such as display style, line style, font style, offset, threshold and index.
- The colours for the key levels can also be customised.
- The script uses a 'switch' function and selected input parameters to set display, line and font styles.
- The key levels are constructed using the data received and the selected styles and colours.
- A unique cycle helps to improve the readability of the levels without "polluting" the graph with multiple labels
- In addition, I have left hints in the indicator to help you understand it better.
For Pine coders.
Why did I create it when there are many counterparts?
Simply because counterparts have very large and complex code and modest functionality and flex.
Here I have managed to fit it into 100 lines still readable.
You can learn how to call lots of lines and marks with just one function.
I also created a unique loop that connects labels if they are too close together for better visibility on a plot.
I have left detailed comments for each action.
I would be glad if someone could tell me how to make it more easier.
OHLC [TFO]Keep higher timeframe OHLC in mind by watching the candle form on LTF charts. Inspired by ICT concepts, specifically concerning the daily OHLC.

OHLC ToolOHLC Tool allows you to display Current or Historical OHLC Values as horizontal lines that extend to the right on your chart.
Features
Variable Lookback to display a specific historical bar's values. Default = 1 (Previous Candle)
Customizable Timeframe to view HTF Candle values.
Custom Line Colors, Styles, and Thicknesses.
Price Scale Value Display Capability.
For displaying the line values and labels on the price scale you will need to enable:
"Indicator and financials name labels"
and
"Indicator and financials value labels"
These options are found in the Price Scale Menu under Labels. Price Scale Menu > Labels
When you do this you will notice your other indicator values will also be on the price scale,
if you wish to disable these, go to the indicator settings under the "Style" Tab, Uncheck the "Labels on price scale" box.
Indicator Settings > Style > "Labels on price scale"
Enjoy!

Simple OHLC Custom Range Interactive█ OVERVIEW
This indicator show lines of OHLC which can be commonly used as support and resistance zones.
OHLC can be shown table with candlestick visual.
Color of candlestick depends on direction of bullish / bearish of the chosen candlestick.
█ INSPIRATION
Inspired by design, code and usage of CAGR . Basic usage of custom range / interactive, pretty much explained here . Credits to TradingView .
█ FEATURES
Table can positioned by any position and font size can be resized.
OHLC can be in full or simple name.
Lines can be extend either right, left, both or none.
█ HOW TO USE
Only 1 point is required.
Dont worry about magnet, point will attached depends on High or Low of the candle.
█ USAGE / TIPS EXAMPLES (Description explained in each image)

OHMLC Candles LevelsPlot Open / High / Middle / Low / Close Lines of current and previous candles.
The indicator is Multi-Timeframe.
Choose the line style and the type of extension.

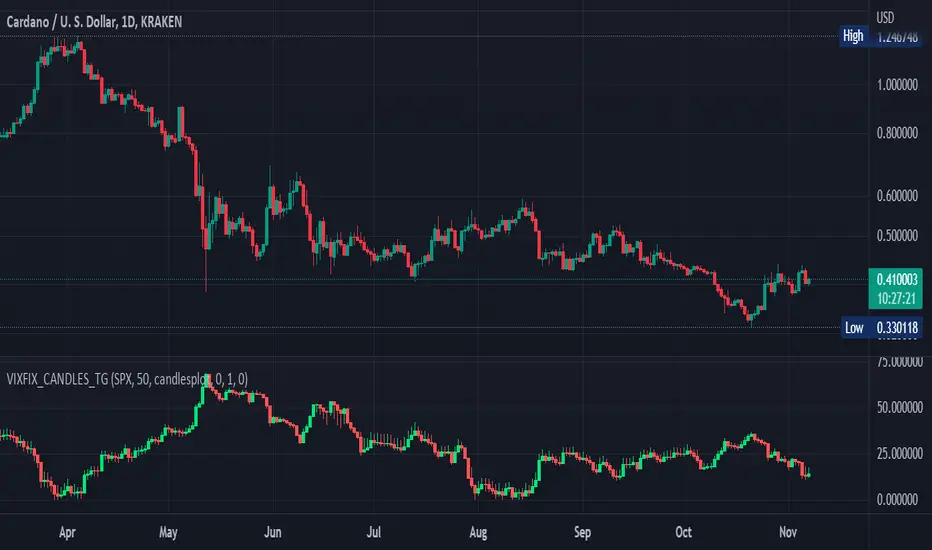
Williams Vix Fix OHLC candles plot indicator (Tartigradia)OHLC candles plot of the Williams VixFix indicator, which allows to draw trend lines.
Williams VixFix is a realized volatility indicator developed by Larry Williams, and can help in finding market bottoms.
Indeed, as Williams describe in his paper, markets tend to find the lowest prices during times of highest volatility, which usually accompany times of highest fear. The VixFix is calculated as how much the current low price statistically deviates from the maximum within a given look-back period.
The Williams VixFix indicator is usually presented as a curve or histogram. The novelty of this indicator is to present the data as a OHLC candles plot: whereas the original Williams VixFix calculation only involves the close value, we here use the open, high and low values as well. This led to some mathematical challenges because some of these calculations led to absurd values, so workarounds had to be found, but in the end I think the result was worth it, it reproduces the VIX chart quite well.
A great additional value of the OHLC chart is that it shows not just the close value, but all the values during the session: open, high and low in addition to close. This allows to draw trend lines and can provide additional information on momentum and sentiment. In addition, other indicators can be used on it, as if it was a price chart, such as RSI indicators (see RSI+ (alt) indicator for example).
For more information on the Vix Fix, which is a strategy published under public domain:
The VIX Fix, Larry Williams, Active Trader magazine, December 2007, web.archive.org
Fixing the VIX: An Indicator to Beat Fear, Amber Hestla-Barnhart, Journal of Technical Analysis, March 13, 2015, ssrn.com
Replicating the CBOE VIX using a synthetic volatility index trading algorithm, Dayne Cary and Gary van Vuuren, Cogent Economics & Finance, Volume 7, 2019, Issue 1, doi.org
This indicator includes only the Williams VixFix as an OHLC candles or bars plot, and price / vixfix candles plot, as well as the typical vixfix histogram. Indeed, it is much more practical for unbounded range indicators to be plotted in their own separate panel, hence why this indicator is released separately, so that it can work and be scaled adequately out of the box.
Note that the there are however no bottom buy signals. For a more complete indicator, which also includes the OHLC candles plots present here, but also bottom signals and Inverse VixFix (top signals), see:
Set Index symbol to SPX, and index_current = false, and timeframe Weekly, to reproduce the original VIX as close as possible by the VIXFIX (use the Add Symbol option, because you want to plot CBOE:VIX on the same timeframe as the current chart, which may include extended session / weekends). With the Weekly timeframe, off days / extended session days should not change much, but with lower timeframes this is important, because nights and weekends can change how the graph appears and seemingly make them different because of timing misalignment when in reality they are not when properly aligned.
Daily Profile (Nephew_Sam_)From getting several requests to combine many of my indicators into one, this indicator plots everything you need for a Daily Profile.
1. Session = Current session + Daily dividers + day of the week
2. Open Lines = Plot the open of the day, midnight, week and month
3. Asian Range = Plots the asian range with an option for midpoint and extending lines
4. Previous OHLC = Plot the previous day/week/month OHLC
EVERY line/label/color/size/style is fully customizable in this indicator.
Important to adjust your timezone to get the correct data

Crossover Alerts for Yesterday O/H/L/C , Today Vwap [Zero54]This is a very simple script/indicator that trigger alerts every time the script triggers the following conditions.
1) Script crosses yesterday's (previous day's) high
2) Script crosses yesterday's (previous day's) low
3) Script crosses yesterday's (previous day's) open
4) Script crosses yesterday's (previous day's) close
5) Script crosses today's vwap.
I developed this to keep track of the scripts I follow and I find it useful. Hope you will find it useful too.
Steps to use:
1) Open the ticker for which you want to set the alerts.
2) Add this indicator to the chart.
3) Right Click on the text and set choose "Add Alert"
4) After you have done with setting up the alert, feel free to remove the indicator from the chart. It is not necessary for the indicator to be added in the chart in order for it to work.
5) Repeat 1-4 for all the scripts for which you want to set the alerts.
Be advised: During market open, if you have set alerts for multiple scripts, a tsunami of alerts may be triggered.
If you like this alert indicator, please like/boost it. Feel free to re-use this code however you may wish to. Cheers!

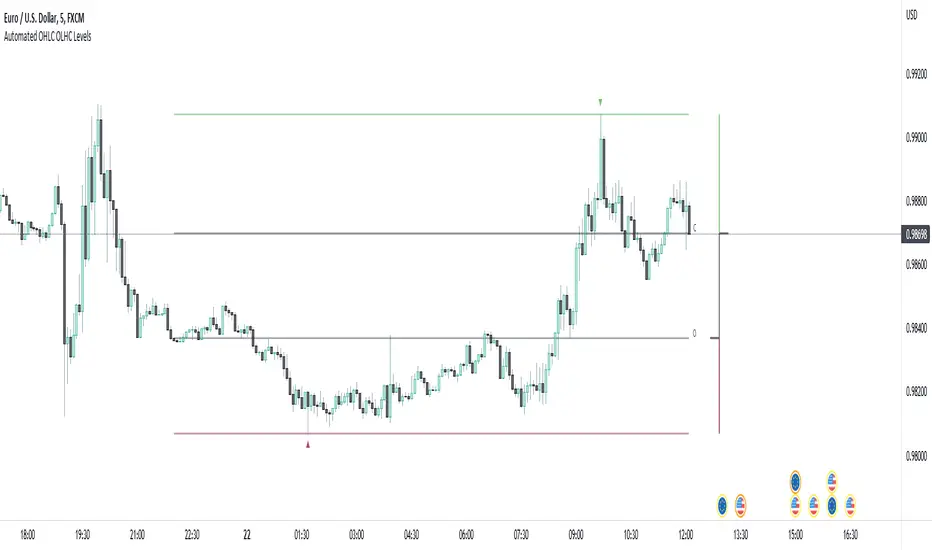
Automated OHLC OLHC LevelsA simple, clean, effective visualization tool, for the OHLC or OLHC of a chosen candle/timeframe.
Apply this indicator using a higher timeframe, in conjunction with other levels and the directional bias, to easily recognize trading opportunities at lower timeframes.