OPEN-SOURCE SCRIPT
The Commitment of Traders (COT) Index
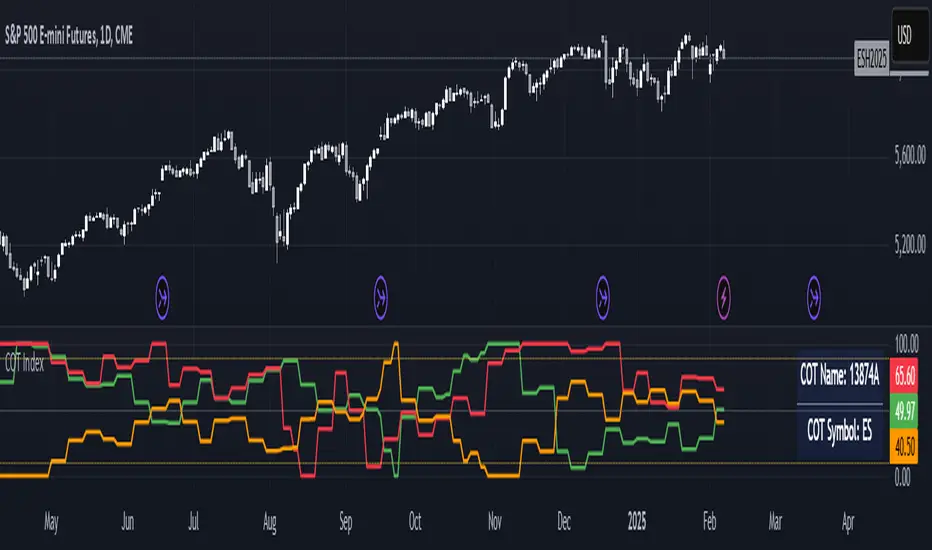
The COT Index indicator is used to measure the positioning of different market participants (Large Traders, Small Traders, and Commercial Hedgers) relative to their historical positioning over a specified lookback period. It helps traders identify extreme positioning, which can signal potential reversals or trend continuations.
Key Features of the Indicator:
COT Data Retrieval
The script pulls COT report data from the TradingView COT Library TradingView/LibraryCOT/3).
It retrieves long and short positions for three key groups:
Large Traders (Non-commercial positions) – Speculators such as hedge funds.
Small Traders (Non-reportable positions) – Small retail traders.
Commercial Hedgers (Commercial positions) – Institutions that hedge real-world positions.
Threshold Zones for Extreme Positioning:
Upper Zone Threshold (Default: 90%)
Signals potential overbought conditions (excessive buying).
Lower Zone Threshold (Default: 10%)
Signals potential oversold conditions (excessive selling).
The indicator plots these zones using horizontal lines.
The COT Index should be used in conjunction with technical analysis (support/resistance, trends, etc.). A high COT Index does not mean the market will reverse immediately—it’s an indication of extreme sentiment.
Note:
If the script does not recognize or can't find the ticker currently viewed in the COT report, the COT indicator will default to U.S. Dollar.
開源腳本
秉持TradingView一貫精神,這個腳本的創作者將其設為開源,以便交易者檢視並驗證其功能。向作者致敬!您可以免費使用此腳本,但請注意,重新發佈代碼需遵守我們的社群規範。
免責聲明
這些資訊和出版物並非旨在提供,也不構成TradingView提供或認可的任何形式的財務、投資、交易或其他類型的建議或推薦。請閱讀使用條款以了解更多資訊。
開源腳本
秉持TradingView一貫精神,這個腳本的創作者將其設為開源,以便交易者檢視並驗證其功能。向作者致敬!您可以免費使用此腳本,但請注意,重新發佈代碼需遵守我們的社群規範。
免責聲明
這些資訊和出版物並非旨在提供,也不構成TradingView提供或認可的任何形式的財務、投資、交易或其他類型的建議或推薦。請閱讀使用條款以了解更多資訊。