INVITE-ONLY SCRIPT
已更新 Ultimate Trend Analyzer by Hypester
Trading is not all about scalping/day trading. To have a healthy and diversified portfolio, you should always have some trending long term assets to mitigate risks and keep your wallet always on the green side.
That's why Hypester once again innovates with the Ultimate Trend Analyzer. With the UTA you can check the trend's health with one glance.
Do not fool yourself, the Ultimate Trend Analyzer offers different trading profiles, so it doesn't matter what kind of trading you are doing, from long positions to intraday scalping - UTA can quickly adapt with one click. UTA offers Swing/Longterm, Day Trading and Scalping profile.
It also has two correlation methods, volume, and price. So you can decide what you want to prioritize most.
Not only that, there are two smoothing methods, linear regression and symmetrical averaging so you can remove noises from your indicator line.
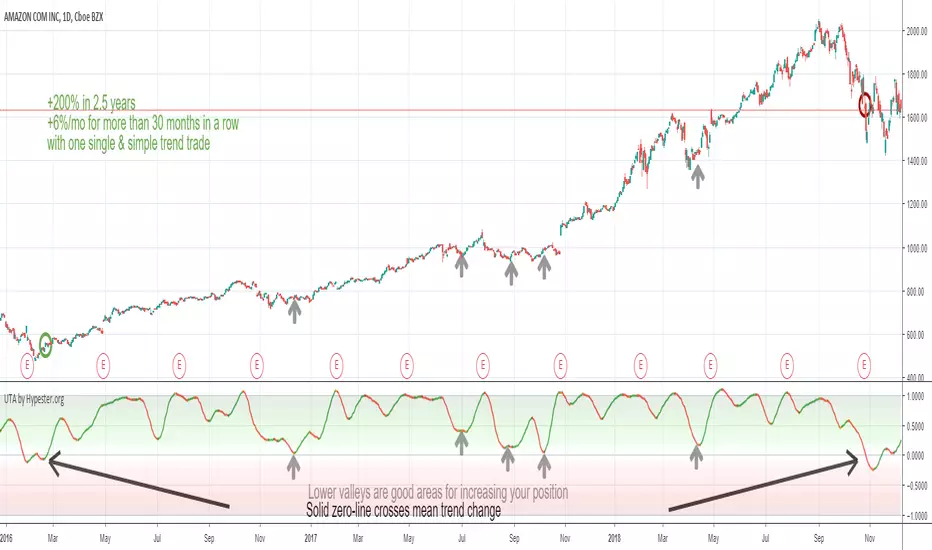
The UTA offers you insight about the trend's health, just by looking at the background color, the stronger the color, stronger the trend. So higher up it is, stronger the uptrend is. The lower it is, stronger the downtrend.
Nevertheless, the UTA also gives you insight within trend corrections and peaks and bottoms with the indicator line color. So if you have a bullish trend and you see an orange line color, it means that direction is changing and you will observe a line color change, which means the course is now bearish even though the overall trend is going up. This feature is great for swing/scalp trading looking at the big picture.
That's why Hypester once again innovates with the Ultimate Trend Analyzer. With the UTA you can check the trend's health with one glance.
Do not fool yourself, the Ultimate Trend Analyzer offers different trading profiles, so it doesn't matter what kind of trading you are doing, from long positions to intraday scalping - UTA can quickly adapt with one click. UTA offers Swing/Longterm, Day Trading and Scalping profile.
It also has two correlation methods, volume, and price. So you can decide what you want to prioritize most.
Not only that, there are two smoothing methods, linear regression and symmetrical averaging so you can remove noises from your indicator line.
The UTA offers you insight about the trend's health, just by looking at the background color, the stronger the color, stronger the trend. So higher up it is, stronger the uptrend is. The lower it is, stronger the downtrend.
Nevertheless, the UTA also gives you insight within trend corrections and peaks and bottoms with the indicator line color. So if you have a bullish trend and you see an orange line color, it means that direction is changing and you will observe a line color change, which means the course is now bearish even though the overall trend is going up. This feature is great for swing/scalp trading looking at the big picture.
發行說明
Small bugfix.僅限邀請腳本
僅作者批准的使用者才能訪問此腳本。您需要申請並獲得使用許可,通常需在付款後才能取得。更多詳情,請依照作者以下的指示操作,或直接聯絡spectertrading。
TradingView不建議在未完全信任作者並了解其運作方式的情況下購買或使用腳本。您也可以在我們的社群腳本中找到免費的開源替代方案。
作者的說明
免責聲明
這些資訊和出版物並非旨在提供,也不構成TradingView提供或認可的任何形式的財務、投資、交易或其他類型的建議或推薦。請閱讀使用條款以了解更多資訊。
僅限邀請腳本
僅作者批准的使用者才能訪問此腳本。您需要申請並獲得使用許可,通常需在付款後才能取得。更多詳情,請依照作者以下的指示操作,或直接聯絡spectertrading。
TradingView不建議在未完全信任作者並了解其運作方式的情況下購買或使用腳本。您也可以在我們的社群腳本中找到免費的開源替代方案。
作者的說明
免責聲明
這些資訊和出版物並非旨在提供,也不構成TradingView提供或認可的任何形式的財務、投資、交易或其他類型的建議或推薦。請閱讀使用條款以了解更多資訊。