OPEN-SOURCE SCRIPT
已更新 ATR Stop Buffer
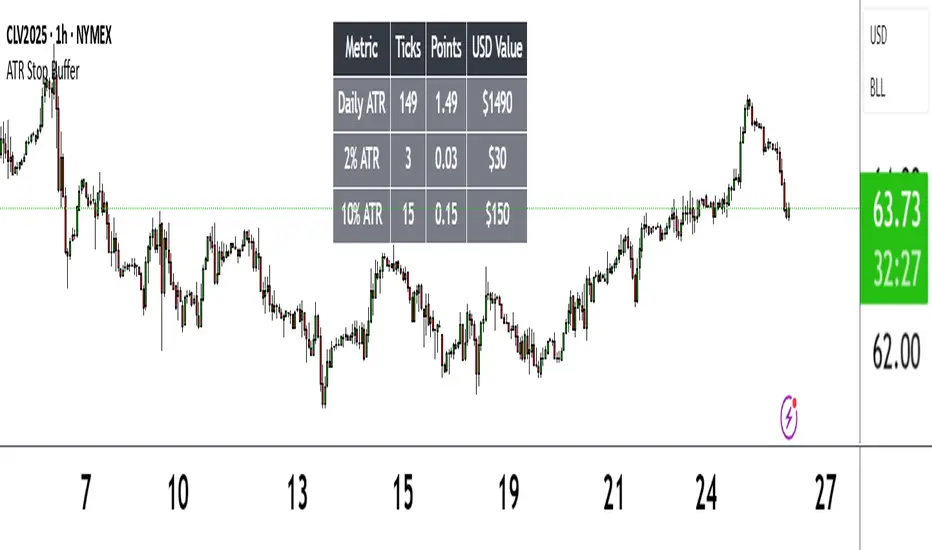
The ATR Stop Buffer indicator calculates the Daily Average True Range (ATR) and converts it into ticks based on the symbol's minimum price movement. It then displays the full ATR, 2% of ATR, and 10% of ATR in a clean table format, rounded up for simplicity. This tool is ideal for traders who want to set volatility-based stop-loss levels or buffers for their trades.
Key Features:
- Uses a 14-period Daily ATR for robust volatility measurement.
- Converts ATR into ticks for precise application across different instruments.
- Table display with toggle option for flexibility.
- Perfect for risk management and trade planning.
How to Use:
1. Add the indicator to your chart.
2. Use the table values to adjust your stop-loss distances (e.g., 2% ATR for tight stops, 10% ATR for wider buffers).
3. Toggle the table off if you only need the values occasionally.
Note: Works best on instruments with defined tick sizes (e.g., futures, forex, stocks).
發行說明
ATR Stop Buffer displays the Daily Average True Range (ATR) and customizable percentage values in ticks, points, and USD, shown in a table. Helps traders set volatility-based stop-loss buffers.Features:
Calculates 14-period Daily ATR in ticks and points using the symbol's tick size.
Shows customizable ATR percentages (default: 2% and 10%) for stop-loss sizing.
Displays USD values for ATR and percentages, based on symbol data.
Customizable table with options for position, colors, font size, and row visibility.
How to Use:
Add to chart and adjust "Display Options" to customize table settings and percentages.
Use table values (ticks, points, USD) for stop-loss or buffer levels.
Notes:
Best for daily charts or lower timeframes using daily ATR.
USD calculations rely on symbol data; verify asset compatibility.
Toggle percentage rows to simplify display if needed.
開源腳本
秉持TradingView一貫精神,這個腳本的創作者將其設為開源,以便交易者檢視並驗證其功能。向作者致敬!您可以免費使用此腳本,但請注意,重新發佈代碼需遵守我們的社群規範。
免責聲明
這些資訊和出版物並非旨在提供,也不構成TradingView提供或認可的任何形式的財務、投資、交易或其他類型的建議或推薦。請閱讀使用條款以了解更多資訊。
開源腳本
秉持TradingView一貫精神,這個腳本的創作者將其設為開源,以便交易者檢視並驗證其功能。向作者致敬!您可以免費使用此腳本,但請注意,重新發佈代碼需遵守我們的社群規範。
免責聲明
這些資訊和出版物並非旨在提供,也不構成TradingView提供或認可的任何形式的財務、投資、交易或其他類型的建議或推薦。請閱讀使用條款以了解更多資訊。