OPEN-SOURCE SCRIPT
HLC3_Z
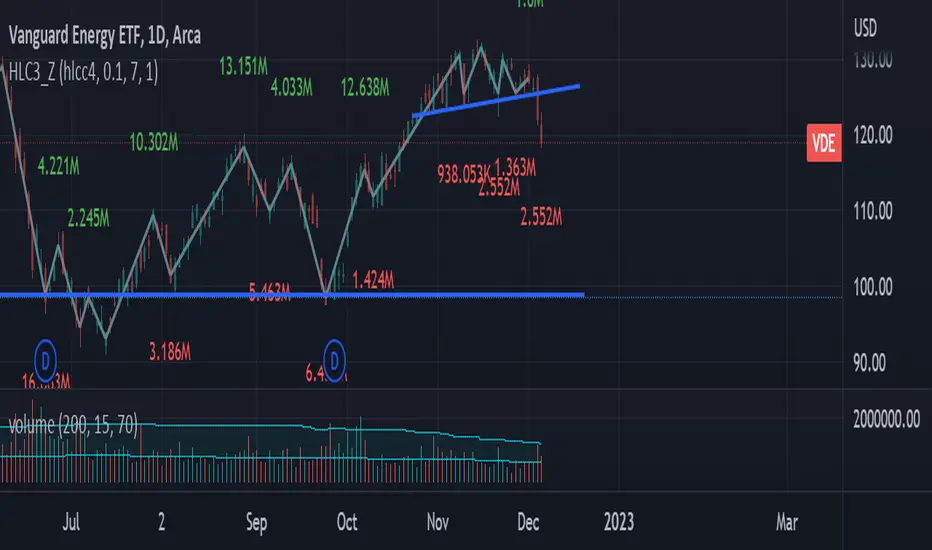
This indicator uses a single price point for each session (HLC3 by default) to draw waves.
This helps to filter out small or high frequency fluctuation in the price, and focus on the trend.
There are also options to display cumulative volume for each wave, or to overlay the price source to draw the wave on the chart.
I find using this indicator helps with finding the wave structures or the head or bottom structures such as head-and-shoulder.
開源腳本
秉持TradingView一貫精神,這個腳本的創作者將其設為開源,以便交易者檢視並驗證其功能。向作者致敬!您可以免費使用此腳本,但請注意,重新發佈代碼需遵守我們的社群規範。
免責聲明
這些資訊和出版物並非旨在提供,也不構成TradingView提供或認可的任何形式的財務、投資、交易或其他類型的建議或推薦。請閱讀使用條款以了解更多資訊。
開源腳本
秉持TradingView一貫精神,這個腳本的創作者將其設為開源,以便交易者檢視並驗證其功能。向作者致敬!您可以免費使用此腳本,但請注意,重新發佈代碼需遵守我們的社群規範。
免責聲明
這些資訊和出版物並非旨在提供,也不構成TradingView提供或認可的任何形式的財務、投資、交易或其他類型的建議或推薦。請閱讀使用條款以了解更多資訊。