OPEN-SOURCE SCRIPT
Price Outpaces Moving Average
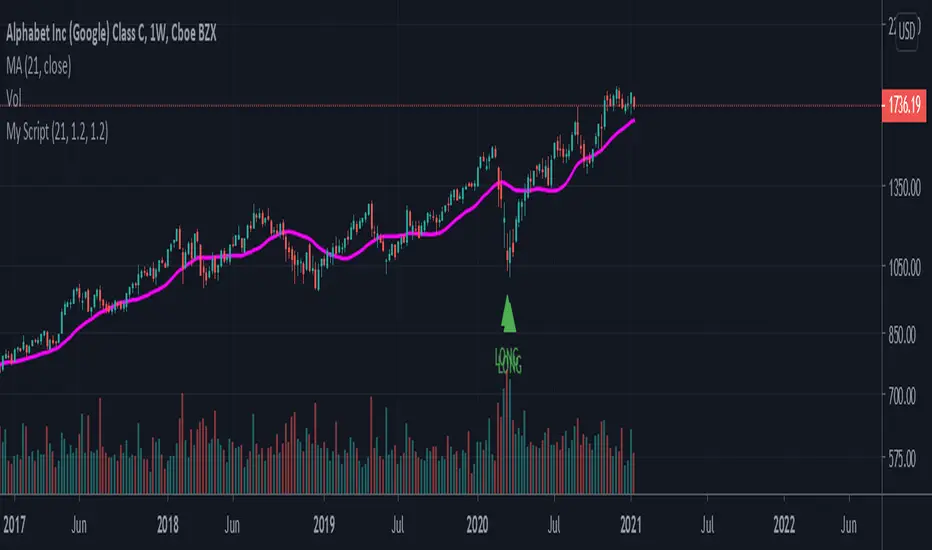
With inputs for the moving average, Bullish overshoot percentage, and bearish overshoot percentage, this indicator is attempting to show market tops based on the difference between the current price of an asset and how far away it is from its moving average.
If you have the bullish overshoot percentage set to 1.5:
let's say price is currently at 20,000 and the moving average is around 6500.
The script calculates 20,000/6500 = 3.07
Then, there is a boolean comparison asking if 3.07 > 1.5.
Since it is, the script will create a "SHORT" flag above that candlestick.
A similar process happens for the "LONG" flags.
開源腳本
秉持TradingView一貫精神,這個腳本的創作者將其設為開源,以便交易者檢視並驗證其功能。向作者致敬!您可以免費使用此腳本,但請注意,重新發佈代碼需遵守我們的社群規範。
免責聲明
這些資訊和出版物並非旨在提供,也不構成TradingView提供或認可的任何形式的財務、投資、交易或其他類型的建議或推薦。請閱讀使用條款以了解更多資訊。
開源腳本
秉持TradingView一貫精神,這個腳本的創作者將其設為開源,以便交易者檢視並驗證其功能。向作者致敬!您可以免費使用此腳本,但請注意,重新發佈代碼需遵守我們的社群規範。
免責聲明
這些資訊和出版物並非旨在提供,也不構成TradingView提供或認可的任何形式的財務、投資、交易或其他類型的建議或推薦。請閱讀使用條款以了解更多資訊。