OPEN-SOURCE SCRIPT
Kaufman Stress Indicator
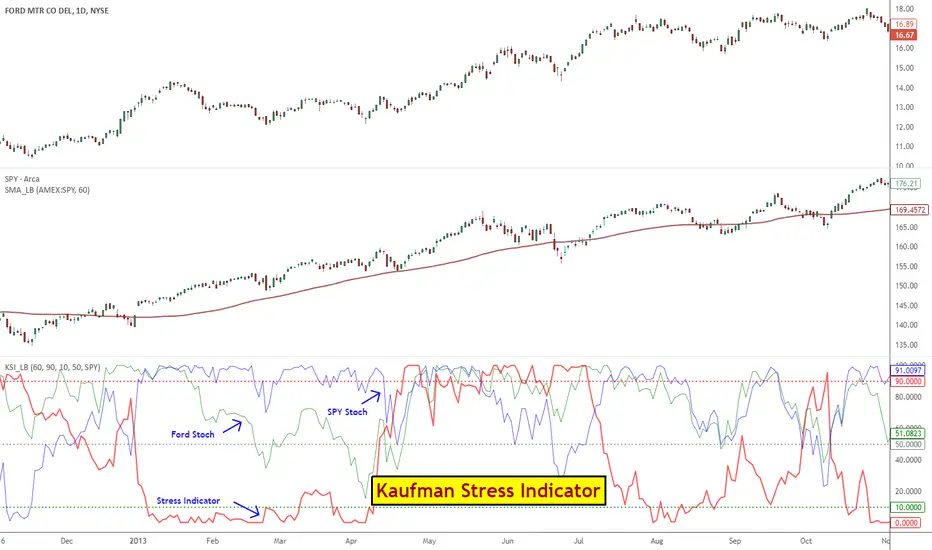
Stress Indicator, first proposed by Mr. Perry Kaufman, provides an easy way for trading pairs / arbs.
Kaufman's trading rules for Stress Indicator:
- Decide on a pair to trade: For ex., AAPL v QQQ
- Calculate the Stress Indicator (SI) for that pair
- Buy the stock when SI 50
- Calculate the 60-day moving average of QQQ
- If the trend of QQQ is down, hedge the stock position with QQQ equal to the risk of the stock using the 20-day ATR of each
- Exit the hedge when the stock position exits, or exit the hedge when the trend of QQQ turns up
- Do not trade stocks under $3
Explanation of all potential SI applications is beyond this post. For more info:
- ptasite.s3.amazonaws.com/videos/StockTimingUsingPairsLogic.pdf
- futuresmag.com/2008/12/15/crossover-relative-value-trading
- kaufmansignals.com/timing/
- TASC 2014 March issue.
Though Kaufman's Stress stategy is built on top of this Stress Indicator, I suggest reading up his full strategy guidelines before applying this.
Kaufman suggests using 60SMA on the index to track the slope. I have included a custom SMA (find it in the middle pane) that can show SMA for any selected symbol. Use the guide below to import that in to your charts: drive.google.com/file/d/0Bx48Du_2aPFncUhIemNrZUY1dTA/edit?usp=sharing
開源腳本
秉持TradingView一貫精神,這個腳本的創作者將其設為開源,以便交易者檢視並驗證其功能。向作者致敬!您可以免費使用此腳本,但請注意,重新發佈代碼需遵守我們的社群規範。
List of my free indicators: bit.ly/1LQaPK8
List of my indicators at Appstore: blog.tradingview.com/?p=970
List of my indicators at Appstore: blog.tradingview.com/?p=970
免責聲明
這些資訊和出版物並非旨在提供,也不構成TradingView提供或認可的任何形式的財務、投資、交易或其他類型的建議或推薦。請閱讀使用條款以了解更多資訊。