PINE LIBRARY
已更新 ZigzagTypes
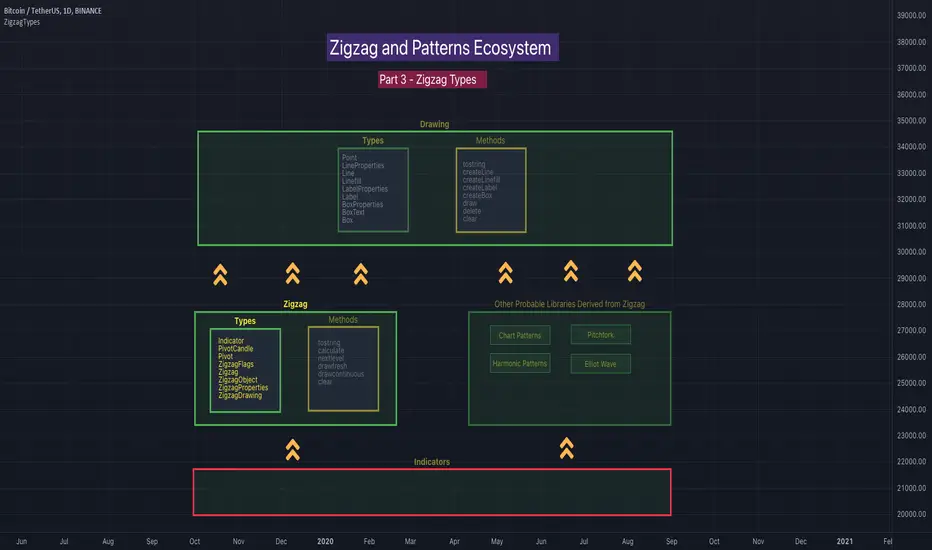
Library "ZigzagTypes"
Zigzag related user defined types. Depends on DrawingTypes library for basic types
Indicator
Indicator is collection of indicator values applied on high, low and close
Fields:
indicatorHigh: Indicator Value applied on High
indicatorLow: Indicator Value applied on Low
PivotCandle
PivotCandle represents data of the candle which forms either pivot High or pivot low or both
Fields:
_high: High price of candle forming the pivot
_low: Low price of candle forming the pivot
length: Pivot length
pHighBar: represents number of bar back the pivot High occurred.
pLowBar: represents number of bar back the pivot Low occurred.
pHigh: Pivot High Price
pLow: Pivot Low Price
indicators: Array of Indicators - allows to add multiple
Pivot
Pivot refers to zigzag pivot. Each pivot can contain various data
Fields:
point: pivot point coordinates
dir: direction of the pivot. Valid values are 1, -1, 2, -2
level: is used for multi level zigzags. For single level, it will always be 0
ratio: Price Ratio based on previous two pivots
indicatorNames: Names of the indicators applied on zigzag
indicatorValues: Values of the indicators applied on zigzag
indicatorRatios: Ratios of the indicators applied on zigzag based on previous 2 pivots
ZigzagFlags
Flags required for drawing zigzag. Only used internally in zigzag calculation. Should not set the values explicitly
Fields:
newPivot: true if the calculation resulted in new pivot
doublePivot: true if the calculation resulted in two pivots on same bar
updateLastPivot: true if new pivot calculated replaces the old one.
Zigzag
Zigzag object which contains whole zigzag calculation parameters and pivots
Fields:
length: Zigzag length. Default value is 5
numberOfPivots: max number of pivots to hold in the calculation. Default value is 20
offset: Bar offset to be considered for calculation of zigzag. Default is 0 - which means calculation is done based on the latest bar.
level: Zigzag calculation level - used in multi level recursive zigzags
zigzagPivots: array<Pivot> which holds the last n pivots calculated.
flags: ZigzagFlags object which is required for continuous drawing of zigzag lines.
ZigzagObject
Zigzag Drawing Object
Fields:
zigzagLine: Line joining two pivots
zigzagLabel: Label which can be used for drawing the values, ratios, directions etc.
ZigzagProperties
Object which holds properties of zigzag drawing. To be used along with ZigzagDrawing
Fields:
lineColor: Zigzag line color. Default is color.blue
lineWidth: Zigzag line width. Default is 1
lineStyle: Zigzag line style. Default is line.style_solid.
showLabel: If set, the drawing will show labels on each pivot. Default is false
textColor: Text color of the labels. Only applicable if showLabel is set to true.
maxObjects: Max number of zigzag lines to display. Default is 300
xloc: Time/Bar reference to be used for zigzag drawing. Default is Time - xloc.bar_time.
ZigzagDrawing
Object which holds complete zigzag drawing objects and properties.
Fields:
properties: ZigzagProperties object which is used for setting the display styles of zigzag
drawings: array<ZigzagObject> which contains lines and labels of zigzag drawing.
zigzag: Zigzag object which holds the calculations.
發行說明
v2Rearranged the ZigzagDrawing type parameters so that Zigzag object will come in front.
Updated:
ZigzagDrawing
Object which holds complete zigzag drawing objects and properties.
Fields:
zigzag: Zigzag object which holds the calculations.
properties: ZigzagProperties object which is used for setting the display styles of zigzag
drawings: array<ZigzagObject> which contains lines and labels of zigzag drawing.
發行說明
v3Updated:
Pivot
Pivot refers to zigzag pivot. Each pivot can contain various data
Fields:
point (Point type from HeWhoMustNotBeNamed/DrawingTypes/1): pivot point coordinates
dir (series int): direction of the pivot. Valid values are 1, -1, 2, -2
level (series int): is used for multi level zigzags. For single level, it will always be 0
componentIndex (series int): is the lower level zigzag array index for given pivot. Used only in multi level Zigzag Pivots
ratio (series float): Price Ratio based on previous two pivots
indicatorNames (string[]): Names of the indicators applied on zigzag
indicatorValues (float[]): Values of the indicators applied on zigzag
indicatorRatios (float[]): Ratios of the indicators applied on zigzag based on previous 2 pivots
發行說明
v4Updated:
Pivot
Pivot refers to zigzag pivot. Each pivot can contain various data
Fields:
point (Point type from HeWhoMustNotBeNamed/DrawingTypes/1): pivot point coordinates
dir (series int): direction of the pivot. Valid values are 1, -1, 2, -2
level (series int): is used for multi level zigzags. For single level, it will always be 0
componentIndex (series int): is the lower level zigzag array index for given pivot. Used only in multi level Zigzag Pivots
subComponents (series int): is the number of sub waves per each zigzag wave. Only applicable for multi level zigzags
ratio (series float): Price Ratio based on previous two pivots
indicatorNames (string[]): Names of the indicators applied on zigzag
indicatorValues (float[]): Values of the indicators applied on zigzag
indicatorRatios (float[]): Ratios of the indicators applied on zigzag based on previous 2 pivots
發行說明
v5Updated:
Pivot
Pivot refers to zigzag pivot. Each pivot can contain various data
Fields:
point (Point type from HeWhoMustNotBeNamed/DrawingTypes/2): pivot point coordinates
dir (series int): direction of the pivot. Valid values are 1, -1, 2, -2
level (series int): is used for multi level zigzags. For single level, it will always be 0
componentIndex (series int): is the lower level zigzag array index for given pivot. Used only in multi level Zigzag Pivots
subComponents (series int): is the number of sub waves per each zigzag wave. Only applicable for multi level zigzags
ratio (series float): Price Ratio based on previous two pivots
indicatorNames (string[]): Names of the indicators applied on zigzag
indicatorValues (float[]): Values of the indicators applied on zigzag
indicatorRatios (float[]): Ratios of the indicators applied on zigzag based on previous 2 pivots
Pine腳本庫
秉持TradingView一貫精神,作者已將此Pine代碼以開源函式庫形式發佈,方便我們社群中的其他Pine程式設計師重複使用。向作者致敬!您可以在私人專案或其他開源發表中使用此函式庫,但在公開發表中重用此代碼須遵守社群規範。
Trial - trendoscope.io/trial
Subscribe - trendoscope.io/pricing
Blog - docs.trendoscope.io
Subscribe - trendoscope.io/pricing
Blog - docs.trendoscope.io
免責聲明
這些資訊和出版物並非旨在提供,也不構成TradingView提供或認可的任何形式的財務、投資、交易或其他類型的建議或推薦。請閱讀使用條款以了解更多資訊。