PROTECTED SOURCE SCRIPT
AllTheUpsTheresAlwaysDowns
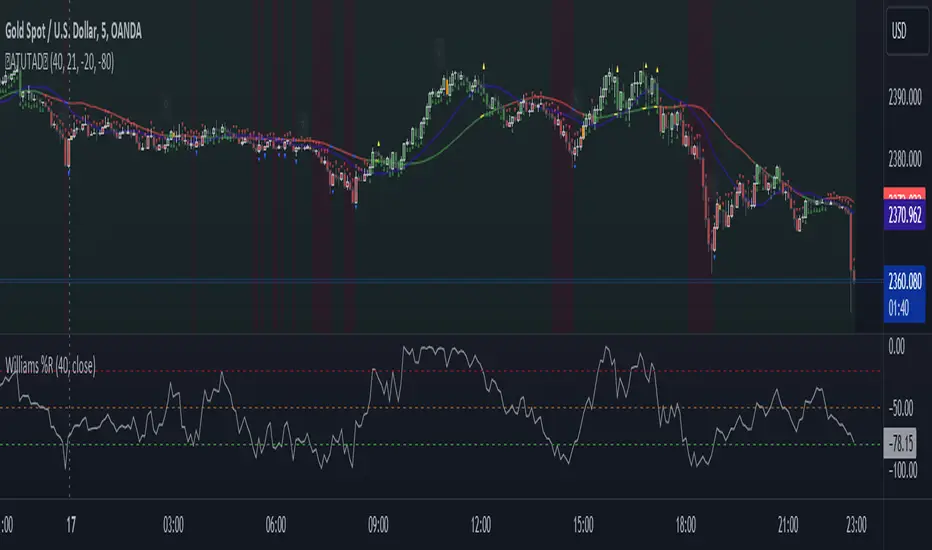
"AllTheUpsTheresAlwaysDowns" ☆ATUTAD☆ // w%r + ma indicator designed for forex trading.

This indicator combines the Williams %R, moving averages, and session tracking.
Key Inputs:
Williams%Range Period: Adjusts the sensitivity of the Williams %R calculation.
Moving Average Period: Defines the period for the moving average used in the indicator.
Overbought and Oversold Thresholds: Sets the thresholds for identifying overbought and oversold conditions.

Features:
Williams %R Calculation: Calculates the Williams %R, a momentum oscillator that measures overbought and oversold levels.
Moving Averages: Plots two moving averages to capitalize on and visualize trend direction.
Session Tracking: Identifies the start and end of trading sessions (Tokyo, London, New York) for better session-based analysis.
Signal Generation: Generates buy/sell signals based on Williams %R levels and moving average crossovers.
Color Coding: Visualizes color-coded bars and shapes to highlight different market conditions and signal types.
Alerts: For buy/sell signals and overbought/oversold conditions to prompt timely actions.

Usage Tips:
Interpret Signals: Trend direction through buy/sell signals and overbought/oversold trend,- reversal / breakout line conditions for potential trading opportunities.
Session Awareness: Take into account the trading sessions (Tokyo, London, New York) to move along with the market dynamics during different times of the day.
Confirmation: Use additional technical analysis tools to confirm signals before executing trades. For example the Williams Percetange Range indicator.
Risk Management: Trade with proper risk management strategies to avoid potential losses.


HappyTrading
This indicator combines the Williams %R, moving averages, and session tracking.
Key Inputs:
Williams%Range Period: Adjusts the sensitivity of the Williams %R calculation.
Moving Average Period: Defines the period for the moving average used in the indicator.
Overbought and Oversold Thresholds: Sets the thresholds for identifying overbought and oversold conditions.
Features:
Williams %R Calculation: Calculates the Williams %R, a momentum oscillator that measures overbought and oversold levels.
Moving Averages: Plots two moving averages to capitalize on and visualize trend direction.
Session Tracking: Identifies the start and end of trading sessions (Tokyo, London, New York) for better session-based analysis.
Signal Generation: Generates buy/sell signals based on Williams %R levels and moving average crossovers.
Color Coding: Visualizes color-coded bars and shapes to highlight different market conditions and signal types.
Alerts: For buy/sell signals and overbought/oversold conditions to prompt timely actions.
Usage Tips:
Interpret Signals: Trend direction through buy/sell signals and overbought/oversold trend,- reversal / breakout line conditions for potential trading opportunities.
Session Awareness: Take into account the trading sessions (Tokyo, London, New York) to move along with the market dynamics during different times of the day.
Confirmation: Use additional technical analysis tools to confirm signals before executing trades. For example the Williams Percetange Range indicator.
Risk Management: Trade with proper risk management strategies to avoid potential losses.
HappyTrading
受保護腳本
此腳本以閉源形式發佈。 不過,您可以自由使用,沒有任何限制 — 點擊此處了解更多。
免責聲明
這些資訊和出版物並非旨在提供,也不構成TradingView提供或認可的任何形式的財務、投資、交易或其他類型的建議或推薦。請閱讀使用條款以了解更多資訊。
免責聲明
這些資訊和出版物並非旨在提供,也不構成TradingView提供或認可的任何形式的財務、投資、交易或其他類型的建議或推薦。請閱讀使用條款以了解更多資訊。