OPEN-SOURCE SCRIPT
D-LEVELS **FUTURECODE**
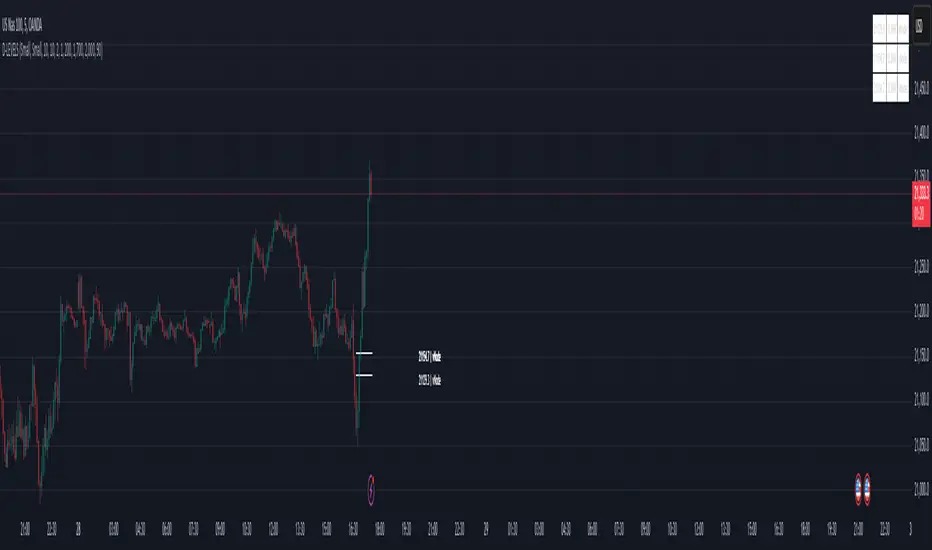
The D-LEVELS indicator helps traders identify key price levels based on high-volume nodes and their relative positions to the current price. It visually displays these dynamic levels on the chart, offering insights into potential support, resistance, or zones of interest for trading decisions.
Key Features for Traders:
Dynamic Volume Nodes: Highlights high-volume price levels across different lookback periods, which can act as support or resistance.
Custom Alerts: Warns traders when price is within a specified percentage range of these levels.
Visual Cues: Uses labels and lines with customizable colors and widths for better chart clarity.
Table Display: Summarizes volume node price levels and their relative percentages for quick reference.
Customization: Flexible input options for text size, colors, and display settings to adapt to individual trading styles.
Use Case:
Traders can incorporate this indicator into their strategy to identify high-probability zones for entries, exits, or trade management by observing the interaction of price with these volume-based levels.
開源腳本
秉持TradingView一貫精神,這個腳本的創作者將其設為開源,以便交易者檢視並驗證其功能。向作者致敬!您可以免費使用此腳本,但請注意,重新發佈代碼需遵守我們的社群規範。
免責聲明
這些資訊和出版物並非旨在提供,也不構成TradingView提供或認可的任何形式的財務、投資、交易或其他類型的建議或推薦。請閱讀使用條款以了解更多資訊。
免責聲明
這些資訊和出版物並非旨在提供,也不構成TradingView提供或認可的任何形式的財務、投資、交易或其他類型的建議或推薦。請閱讀使用條款以了解更多資訊。