OPEN-SOURCE SCRIPT
The RSP/VOO indicator
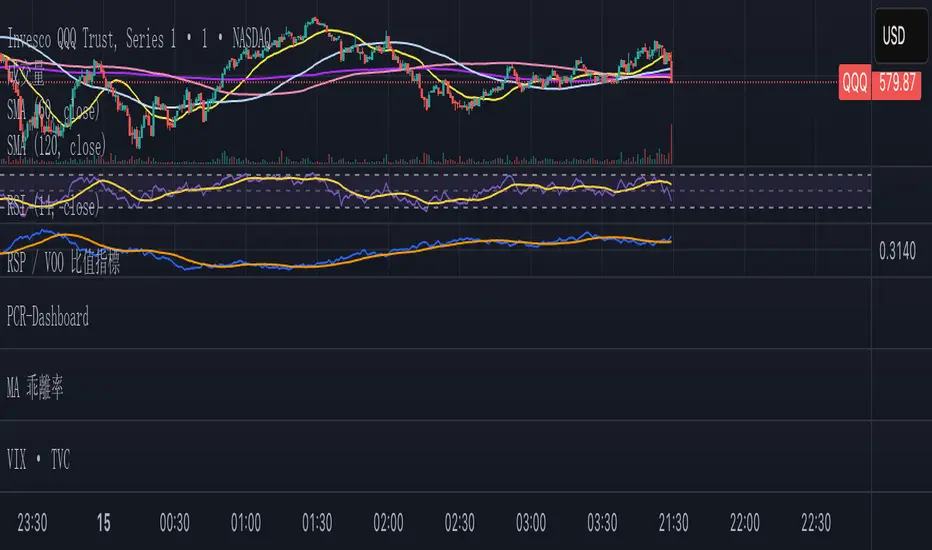
The RSP/VOO indicator refers to the ratio between the performance of two exchange-traded funds (ETFs): RSP (Invesco S&P 500 Equal Weight ETF) and VOO (Vanguard S&P 500 ETF). RSP tracks an equal-weighted version of the S&P 500 index, meaning each of the 500 stocks in the index is given the same weight regardless of company size. In contrast, VOO is a market-cap-weighted ETF, where larger companies (like Apple or Microsoft) have a greater influence on the fund's performance based on their market capitalization.
This ratio (RSP divided by VOO) is often used as a market breadth indicator in finance. When the RSP/VOO ratio rises, it suggests that smaller or mid-sized stocks in the S&P 500 are outperforming the largest ones, indicating broader market participation and potentially healthier overall market conditions. Conversely, when the ratio falls, it implies that a few mega-cap stocks are driving the market's gains, which can signal increased concentration risk or a narrower rally. For example, RSP provides more diversified exposure by reducing concentration in large-cap stocks, while VOO reflects the dominance of top-weighted holdings. Investors might monitor this ratio to gauge market sentiment, with RSP historically showing higher expense ratios (around 0.20%) compared to VOO's lower fees (about 0.03%), but offering potentially better risk-adjusted returns in certain environments.1.6秒
This ratio (RSP divided by VOO) is often used as a market breadth indicator in finance. When the RSP/VOO ratio rises, it suggests that smaller or mid-sized stocks in the S&P 500 are outperforming the largest ones, indicating broader market participation and potentially healthier overall market conditions. Conversely, when the ratio falls, it implies that a few mega-cap stocks are driving the market's gains, which can signal increased concentration risk or a narrower rally. For example, RSP provides more diversified exposure by reducing concentration in large-cap stocks, while VOO reflects the dominance of top-weighted holdings. Investors might monitor this ratio to gauge market sentiment, with RSP historically showing higher expense ratios (around 0.20%) compared to VOO's lower fees (about 0.03%), but offering potentially better risk-adjusted returns in certain environments.1.6秒
開源腳本
秉持TradingView一貫精神,這個腳本的創作者將其設為開源,以便交易者檢視並驗證其功能。向作者致敬!您可以免費使用此腳本,但請注意,重新發佈代碼需遵守我們的社群規範。
免責聲明
這些資訊和出版物並非旨在提供,也不構成TradingView提供或認可的任何形式的財務、投資、交易或其他類型的建議或推薦。請閱讀使用條款以了解更多資訊。
開源腳本
秉持TradingView一貫精神,這個腳本的創作者將其設為開源,以便交易者檢視並驗證其功能。向作者致敬!您可以免費使用此腳本,但請注意,重新發佈代碼需遵守我們的社群規範。
免責聲明
這些資訊和出版物並非旨在提供,也不構成TradingView提供或認可的任何形式的財務、投資、交易或其他類型的建議或推薦。請閱讀使用條款以了解更多資訊。