OPEN-SOURCE SCRIPT
Price Channel Marker
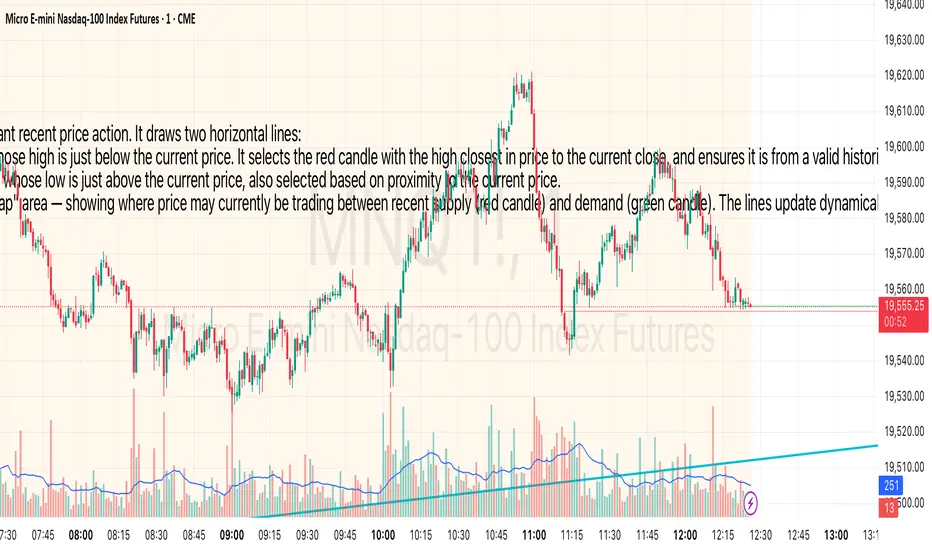
This indicator identifies a dynamic price channel based on the most relevant recent price action. It draws two horizontal lines:
* 🔴 Red Line – Marks the high of the most recent red candle (bearish) whose high is just below the current price. It selects the red candle with the high closest in price to the current close, and ensures it is from a valid historical context (ignoring recent highs above the current price).
* 🟢 Green Line – Marks the low of the most recent green candle (bullish) whose low is just above the current price, also selected based on proximity to the current price.
Together, these two lines define a potential price compression zone or "trap" area — showing where price may currently be trading between recent supply (red candle) and demand (green candle). The lines update dynamically and extend into the future to help visualize breakout or rejection levels.
Use Cases:
* Spot potential breakout zones.
* Define short-term support and resistance.
* Filter for entries in range-bound or squeeze conditions.
Customization:
* Adjustable lookback range (up to 5000 bars).
* Colors and line style are easily customizable.
開源腳本
秉持TradingView一貫精神,這個腳本的創作者將其設為開源,以便交易者檢視並驗證其功能。向作者致敬!您可以免費使用此腳本,但請注意,重新發佈代碼需遵守我們的社群規範。
免責聲明
這些資訊和出版物並非旨在提供,也不構成TradingView提供或認可的任何形式的財務、投資、交易或其他類型的建議或推薦。請閱讀使用條款以了解更多資訊。
開源腳本
秉持TradingView一貫精神,這個腳本的創作者將其設為開源,以便交易者檢視並驗證其功能。向作者致敬!您可以免費使用此腳本,但請注意,重新發佈代碼需遵守我們的社群規範。
免責聲明
這些資訊和出版物並非旨在提供,也不構成TradingView提供或認可的任何形式的財務、投資、交易或其他類型的建議或推薦。請閱讀使用條款以了解更多資訊。