PROTECTED SOURCE SCRIPT
Quantura - Average Intraday Candle Volume
Introduction
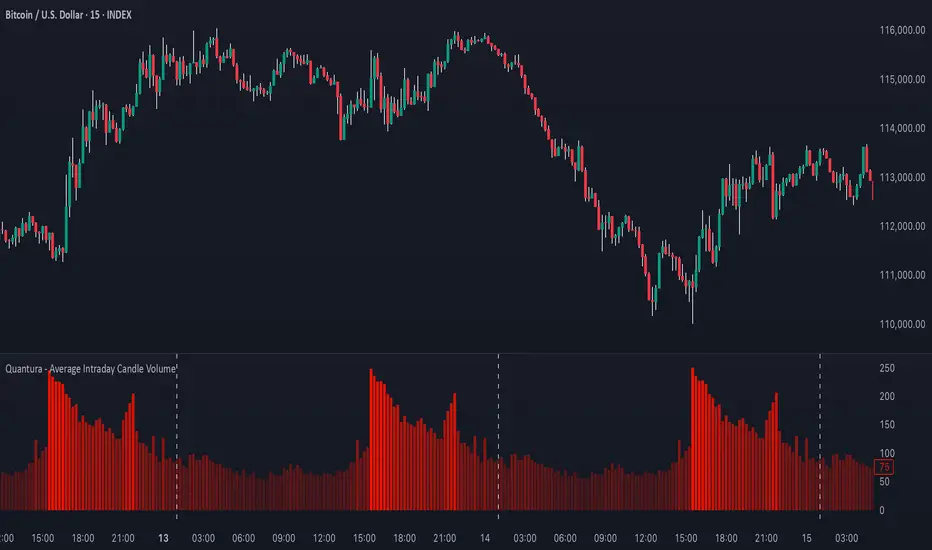
“Quantura – Average Intraday Candle Volume” is a quantitative visualization tool that calculates and displays the average traded volume for each intraday time position based on a user-defined historical lookback period. It allows traders to analyze recurring intraday volume patterns, identify high-activity sessions, and detect liquidity shifts throughout the trading day.
Originality & Value
This indicator goes beyond standard volume averages by normalizing and aligning volume data according to the time of day. Instead of simply smoothing recent bars, it builds an intraday volume profile based on historical daily averages, enabling users to understand when during the day volume typically peaks or drops.
Its originality and usefulness come from:
Functionality & Core Logic
Parameters & Customization
Visualization & Display
Use Cases
Limitations & Recommendations
Markets & Timeframes
Compatible with all intraday markets — including crypto, Forex, equities, and futures — and all intraday timeframes (from 1 minute to 4 hours). It is particularly valuable for analyzing assets with continuous 24-hour trading activity.
Author & Access
Developed 100% by Quantura. Published as a protected source script indicator. Access is free.
Important
This description complies with TradingView’s Script Publishing and House Rules. It provides a clear explanation of the indicator’s originality, logic, and purpose, without any unrealistic performance or predictive claims.
“Quantura – Average Intraday Candle Volume” is a quantitative visualization tool that calculates and displays the average traded volume for each intraday time position based on a user-defined historical lookback period. It allows traders to analyze recurring intraday volume patterns, identify high-activity sessions, and detect liquidity shifts throughout the trading day.
Originality & Value
This indicator goes beyond standard volume averages by normalizing and aligning volume data according to the time of day. Instead of simply smoothing recent bars, it builds an intraday volume profile based on historical daily averages, enabling users to understand when during the day volume typically peaks or drops.
Its originality and usefulness come from:
- Converting standard volume data into time-aligned intraday averages.
- Visualization of historical intraday liquidity behavior, not just total daily volume.
- Dynamic scaling using normalization and transparency to emphasize active and quiet periods.
- Optional day-separator lines for precise intraday structure recognition.
- Gradient-based coloring for better visual interpretation of volume intensity.
Functionality & Core Logic
- The indicator divides each day into discrete intraday time positions (based on chart timeframe).
- For each position, it stores and updates historical volume values across the selected number of days.
- It calculates an average volume per time position by aggregating all stored values and dividing them by the number of valid days.
- The result is plotted as a continuous histogram showing typical intraday volume distribution.
- The bar colors and transparency dynamically reflect the relative intensity of volume at each point in the day.
Parameters & Customization
- Number of Days for Averaging: Defines how many past days are included in the volume average calculation (default: 365).
- UTC Offset: Allows synchronization of intraday cycles with local or exchange time zones.
- Base Color: Sets the main color for plotted volume columns.
- Color Mode: Choose between “Gradient” (transparency dynamically adjusts by intensity) or “Normal” (fixed opacity).
- Day Line: Toggles dashed vertical lines marking the start of each trading day.
Visualization & Display
- Volume is plotted as a series of histogram bars, each representing the average volume for a specific intraday time position.
- A gradient color mode enhances readability by fading lower-intensity areas and highlighting high-volume regions.
- Optional day-separator lines visually segment historical sessions for easy reference.
- Works seamlessly across all chart timeframes that divide the 24-hour day into regular bar intervals.
Use Cases
- Identify when trading activity typically peaks (e.g., session opens, news windows, or overlapping markets).
- Compare current intraday volume to historical averages for early anomaly detection.
- Enhance algorithmic or discretionary strategies that depend on volume-timing alignment.
- Combine with volatility or price structure indicators to confirm market activity zones.
- Evaluate session consistency across different time zones using the UTC offset parameter.
Limitations & Recommendations
- The indicator requires intraday data (below 1D resolution) to function properly.
- Volume behavior may vary across brokers and assets; adjust averaging period accordingly.
- Does not predict price movement — it provides volume-based context for analysis.
- Works best when combined with structure or momentum-based indicators.
Markets & Timeframes
Compatible with all intraday markets — including crypto, Forex, equities, and futures — and all intraday timeframes (from 1 minute to 4 hours). It is particularly valuable for analyzing assets with continuous 24-hour trading activity.
Author & Access
Developed 100% by Quantura. Published as a protected source script indicator. Access is free.
Important
This description complies with TradingView’s Script Publishing and House Rules. It provides a clear explanation of the indicator’s originality, logic, and purpose, without any unrealistic performance or predictive claims.
受保護腳本
此腳本以閉源形式發佈。 不過,您可以自由且不受任何限制地使用它 — 在此處了解更多資訊。
Get instant access at quantura.io/
免責聲明
這些資訊和出版物並不意味著也不構成TradingView提供或認可的金融、投資、交易或其他類型的意見或建議。請在使用條款閱讀更多資訊。
受保護腳本
此腳本以閉源形式發佈。 不過,您可以自由且不受任何限制地使用它 — 在此處了解更多資訊。
Get instant access at quantura.io/
免責聲明
這些資訊和出版物並不意味著也不構成TradingView提供或認可的金融、投資、交易或其他類型的意見或建議。請在使用條款閱讀更多資訊。