OPEN-SOURCE SCRIPT
已更新 Major Currency RSI Indicator (MCRSI)
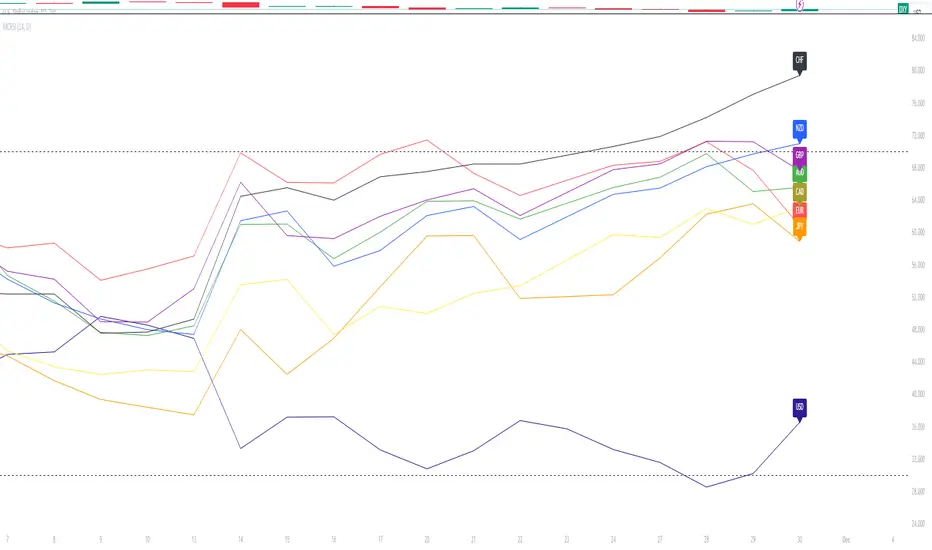
Experience the power of multi-dimensional analysis with our Multi-Currency RSI Indicator (MCRSI). This innovative tool allows traders to simultaneously track and compare the Relative Strength Index (RSI) of eight different currencies in a single chart.
The MCRSI calculates the RSI for USD (DXY), EUR (EXY), JPY (JXY), CAD (CXY), AUD (AXY), NZD (ZXY), GBP (BXY), and CHF (SXY), covering a broad range of the forex market. Each RSI line is color-coded for easy differentiation and equipped with labels at the last bar for a clutter-free view.
Our indicator is designed with user-friendly customization features. You can easily adjust the length of the RSI and the time frame according to your trading strategy. It also handles gaps in the chart data with the barmerge.gaps_on option, ensuring accurate and consistent RSI calculations.
Whether you are a novice trader seeking to understand market dynamics better or an experienced trader wanting to diversify your technical analysis, the MCRSI offers a unique perspective of the forex market. This multi-currency approach can help identify potential trading opportunities that could be missed when analyzing currencies in isolation.
Harness the power of multi-currency RSI analysis with our MCRSI Indicator. It's time to step up your trading game!
Features:
Tracks 8 different currencies simultaneously
Color-coded RSI lines for easy identification
Customizable RSI length and time frame
Handles gaps in chart data
Last bar labels for a clutter-free view
Ideal for forex traders of all experience levels
How to Use:
Add the MCRSI to your TradingView chart.
Adjust the RSI length and time frame as needed.
Monitor the RSI lines and their intersections for potential trading signals.
Happy trading!
發行說明
We have changed the location of the labels to make it easier to comprehend by users開源腳本
秉持TradingView一貫精神,這個腳本的創作者將其設為開源,以便交易者檢視並驗證其功能。向作者致敬!您可以免費使用此腳本,但請注意,重新發佈代碼需遵守我們的社群規範。
免責聲明
這些資訊和出版物並非旨在提供,也不構成TradingView提供或認可的任何形式的財務、投資、交易或其他類型的建議或推薦。請閱讀使用條款以了解更多資訊。
開源腳本
秉持TradingView一貫精神,這個腳本的創作者將其設為開源,以便交易者檢視並驗證其功能。向作者致敬!您可以免費使用此腳本,但請注意,重新發佈代碼需遵守我們的社群規範。
免責聲明
這些資訊和出版物並非旨在提供,也不構成TradingView提供或認可的任何形式的財務、投資、交易或其他類型的建議或推薦。請閱讀使用條款以了解更多資訊。