OPEN-SOURCE SCRIPT
50,100,200,350 MA
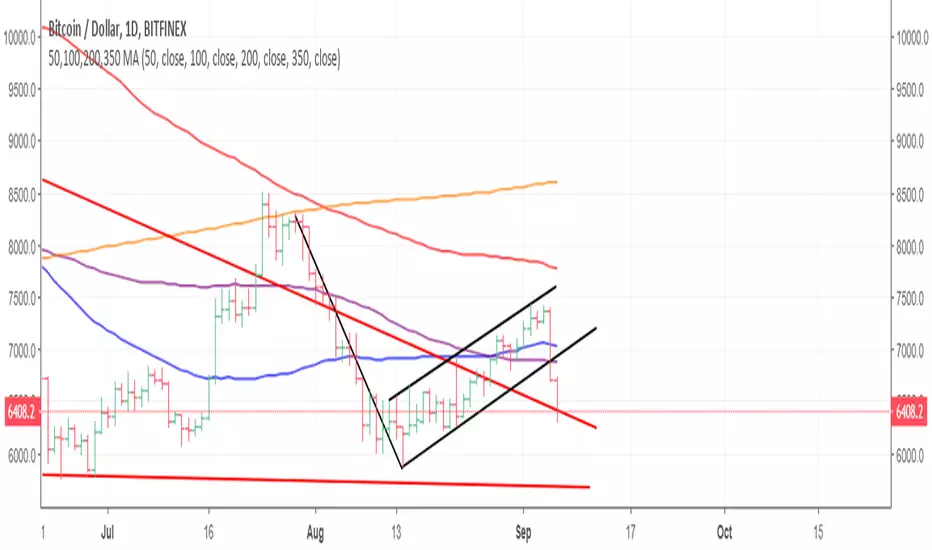
This will display the 50, 100 & 200 moving average (MA) on your charts (also known as Simply Moving Average). When looking at these on a daily chart the 350ma is a representation of the 50 week moving average.
Hope this helps
Good Luck
Simon McCabe
Twitter: @simoncmccabe
Hope this helps
Good Luck
Simon McCabe
Twitter: @simoncmccabe
開源腳本
本著TradingView的真正精神,此腳本的創建者將其開源,以便交易者可以查看和驗證其功能。向作者致敬!雖然您可以免費使用它,但請記住,重新發佈程式碼必須遵守我們的網站規則。
免責聲明
這些資訊和出版物並不意味著也不構成TradingView提供或認可的金融、投資、交易或其他類型的意見或建議。請在使用條款閱讀更多資訊。
免責聲明
這些資訊和出版物並不意味著也不構成TradingView提供或認可的金融、投資、交易或其他類型的意見或建議。請在使用條款閱讀更多資訊。