OPEN-SOURCE SCRIPT
(MACD-Price) Displaying MACD Indicators on Price Charts
hello?
Although it is a simple indicator, I decided to disclose it because I thought it was a pretty useful (?) indicator.
** Others may have previously published indicators similar to this indicator.
** Please understand this.
** All charts or indicators disclosed are not guaranteed to result in profit or loss.
** Therefore, please use it as a reference for your own trading strategy.
(design purpose)
The MACD indicator is a secondary indicator and is located below the price chart.
Accordingly, it is not easy to check along with the price flow.
Therefore, the index has been reorganized to display important factors in interpreting the MACD index according to the price change.
(Metric Description)
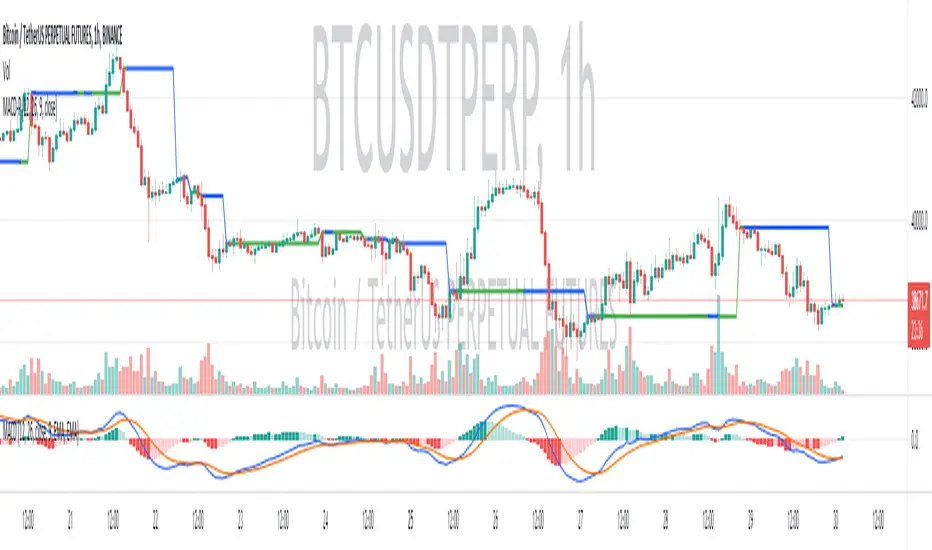
- The center line of the EMA line corresponding to the MACD value and the signal value displayed in the MACD indicator is designed to receive the Close value or Open value among prices according to changes in the rise and fall.
- The color of the line displayed in the manner described above is designed to change color when the Histogram passes the zero point, so that you can check whether the current state is in an uptrend or a downtrend.
Uptrend: green
Downtrend: blue
(How to Interpret and Apply)
- Buy when the 'Buy / Sell line' of the MACD-P indicator is level and the color is green, and when it crosses the 'Buy / Sell line' upwards.
- Sell when the 'Buy / Sell line' of the MACD-P indicator is level and the color is blue, and when it crosses below the 'Buy / Sell line'.
Although it is a simple indicator, I decided to disclose it because I thought it was a pretty useful (?) indicator.
** Others may have previously published indicators similar to this indicator.
** Please understand this.
** All charts or indicators disclosed are not guaranteed to result in profit or loss.
** Therefore, please use it as a reference for your own trading strategy.
(design purpose)
The MACD indicator is a secondary indicator and is located below the price chart.
Accordingly, it is not easy to check along with the price flow.
Therefore, the index has been reorganized to display important factors in interpreting the MACD index according to the price change.
(Metric Description)
- The center line of the EMA line corresponding to the MACD value and the signal value displayed in the MACD indicator is designed to receive the Close value or Open value among prices according to changes in the rise and fall.
- The color of the line displayed in the manner described above is designed to change color when the Histogram passes the zero point, so that you can check whether the current state is in an uptrend or a downtrend.
Uptrend: green
Downtrend: blue
(How to Interpret and Apply)
- Buy when the 'Buy / Sell line' of the MACD-P indicator is level and the color is green, and when it crosses the 'Buy / Sell line' upwards.
- Sell when the 'Buy / Sell line' of the MACD-P indicator is level and the color is blue, and when it crosses below the 'Buy / Sell line'.
開源腳本
秉持TradingView一貫精神,這個腳本的創作者將其設為開源,以便交易者檢視並驗證其功能。向作者致敬!您可以免費使用此腳本,但請注意,重新發佈代碼需遵守我們的社群規範。
※ Follow X to check out the posts.
※ X를 팔로우하고 게시물을 확인하세요.
◆ t.me/readCryptoChannel
[HA-MS Indicator]
bit.ly/3YxHgvN
[OBV Indicator]
bit.ly/4dcyny3
※ X를 팔로우하고 게시물을 확인하세요.
◆ t.me/readCryptoChannel
[HA-MS Indicator]
bit.ly/3YxHgvN
[OBV Indicator]
bit.ly/4dcyny3
免責聲明
這些資訊和出版物並非旨在提供,也不構成TradingView提供或認可的任何形式的財務、投資、交易或其他類型的建議或推薦。請閱讀使用條款以了解更多資訊。