INVITE-ONLY SCRIPT
已更新 [Beta] Volume Delta in Candle v.1.0
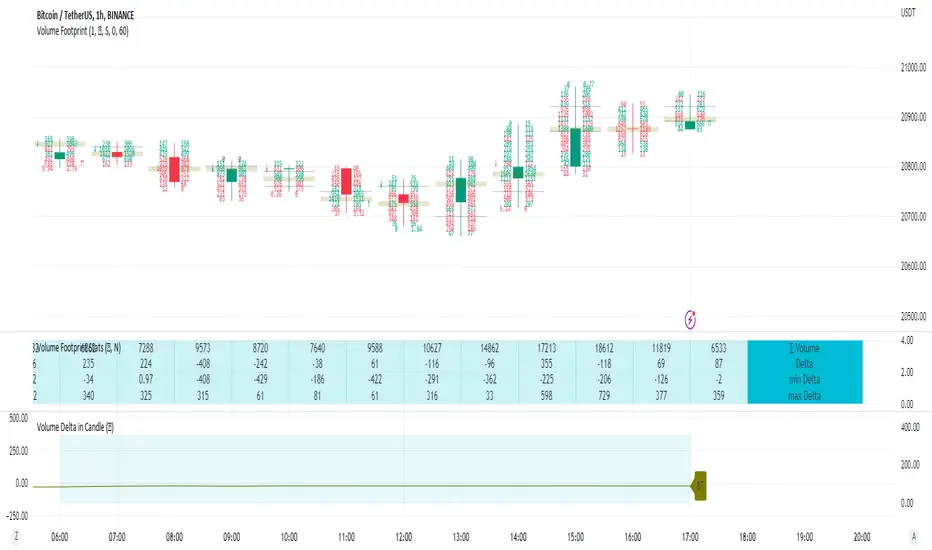
Supporting tool for "Volume Footprint" showing char of delta changes in current candle.
Chart is restarted with start of each new candle.
Script is collecting volume footprint with the precision picked by user. We recomend to use highest possible precision.
Unfortunatelly Trading View has many limitations.
If after adding script nothing is visible with error: "'The study references too many candles in history'" you need to use lower precision - It can be changed in script settings.
This script is a part of a toolkit called "Volume Footprint", containing few more tools:
Volume Footprint - Volume Footprint chart.
Volume Footprint Statistics - Script showing table with basic statistics about Up and Down Volume inside the candle.
Volume Delta - Showing candles of imbalance between Up and Down Volume changes inside candles.
Volume Delta In Candle- Chart showing history of imbalance between Up and Down Volume changes inside current candle.
Volume Cumulative Delta - Showing candles of imbalance changes between UP and Down Volume cumulated in trading time equal to interval.
Volume Cumulative Delta in Interval- Chart showing history of imbalance changes between UP and Down Volume cumulated in trading time equal to interval.
This script can be used by any user. You do not need to have PRO or PREMIUM account to use it.
Script with limited access, contact author to get authorization
User Interface:
Script is drawing a line of values demonstrating how Delta was changing inside current candle.
Current value of Delta is shown in the label on the right side of the chart.
Chart is drawing dynamically and can easiely hit TradingView limitations. If your chart is shorter and ends before vertical line, you can simplify it by turning "Simplify" checkbox in Settings.
Chart also cannot be longer than the source one.
Script settings:
Data precision - One of 6 levels of data precision: ▉▇▆▅▃▁, where ▉ means the highest precision and ▁ the lowest available precision. On 15 minute chart highest precision should be available, but on 1D it will probably hit TradingView limitations and script will not be even launched by the platform with error: "'The study references too many candles in history'". The general recommendation is to use the highest available precision for a given instrument and interval.
Background - Drawing background under chart area.
Line color - Color of data line over the chart.
Simplify drawing - Visualization option that skips some shape detail in exchange for a longer history of value.
Troubleshooting:
In case of any problems, send error details to the author of the script.
Known issues:
"The study references too many candles in history" - Change "Data precision" settings to some lower value.
發行說明
Package of improvements 發行說明
Package of improvements:- Addition precision levels dedicated to 1W and 1M charts.
- Verification with main script feature
- Improved error reporting
僅限邀請腳本
僅作者批准的使用者才能訪問此腳本。您需要申請並獲得使用許可,通常需在付款後才能取得。更多詳情,請依照作者以下的指示操作,或直接聯絡Investor_R。
請注意,此私人、僅限受邀使用者使用的腳本未經腳本審核員審核,其是否符合社群規範尚待確定。 TradingView不建議在未完全信任作者並了解其運作方式的情況下購買或使用腳本。您也可以在我們的社群腳本中找到免費的開源替代方案。
作者的說明
To get access or report problem write on toolkit4trading@proton.me
To get access or report problem write on toolkit4trading@proton.me
More details on Website and Youtube.
More details on Website and Youtube.
免責聲明
這些資訊和出版物並非旨在提供,也不構成TradingView提供或認可的任何形式的財務、投資、交易或其他類型的建議或推薦。請閱讀使用條款以了解更多資訊。