OPEN-SOURCE SCRIPT
Cumulative Volume Delta with MA
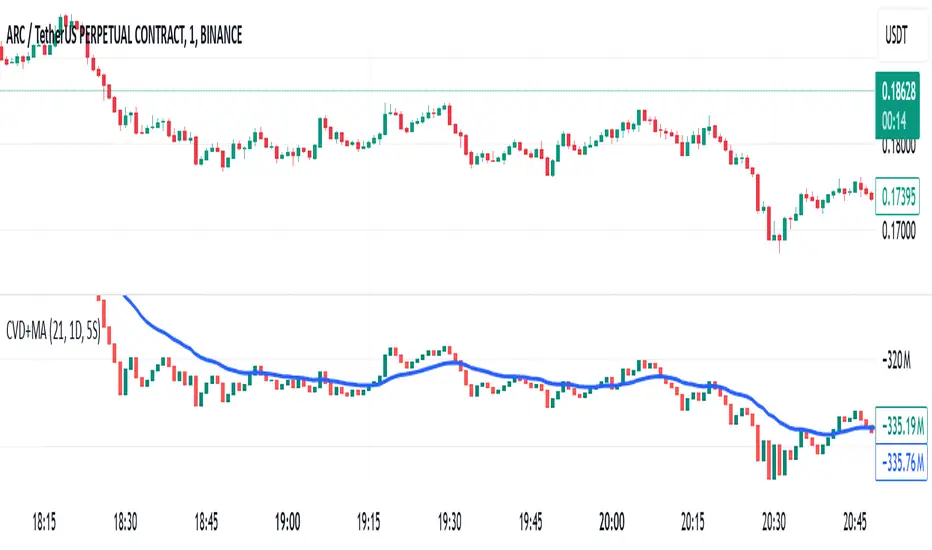
CVD is a volume-based indicator that helps analyze buying and selling pressure in the market. It tracks the difference between buying volume and selling volume, showing whether the market is being accumulated or distributed.
How CVD Works
Volume Delta Calculation:
If price closes higher than the previous bar → Volume is added to CVD (buying pressure).
If price closes lower than the previous bar → Volume is subtracted from CVD (selling pressure).
CVD Cumulative Calculation:
Keeps a running total of volume delta over time.
If the CVD line is rising, buyers are in control; if falling, sellers dominate.
Moving Average on CVD:
A moving average (MA) smooths out the CVD line, helping identify trends more clearly.
Common choices: EMA (Exponential MA) or SMA (Simple MA).
開源腳本
秉持TradingView一貫精神,這個腳本的創作者將其設為開源,以便交易者檢視並驗證其功能。向作者致敬!您可以免費使用此腳本,但請注意,重新發佈代碼需遵守我們的社群規範。
免責聲明
這些資訊和出版物並非旨在提供,也不構成TradingView提供或認可的任何形式的財務、投資、交易或其他類型的建議或推薦。請閱讀使用條款以了解更多資訊。
開源腳本
秉持TradingView一貫精神,這個腳本的創作者將其設為開源,以便交易者檢視並驗證其功能。向作者致敬!您可以免費使用此腳本,但請注意,重新發佈代碼需遵守我們的社群規範。
免責聲明
這些資訊和出版物並非旨在提供,也不構成TradingView提供或認可的任何形式的財務、投資、交易或其他類型的建議或推薦。請閱讀使用條款以了解更多資訊。