PROTECTED SOURCE SCRIPT
MA Distance Indicator
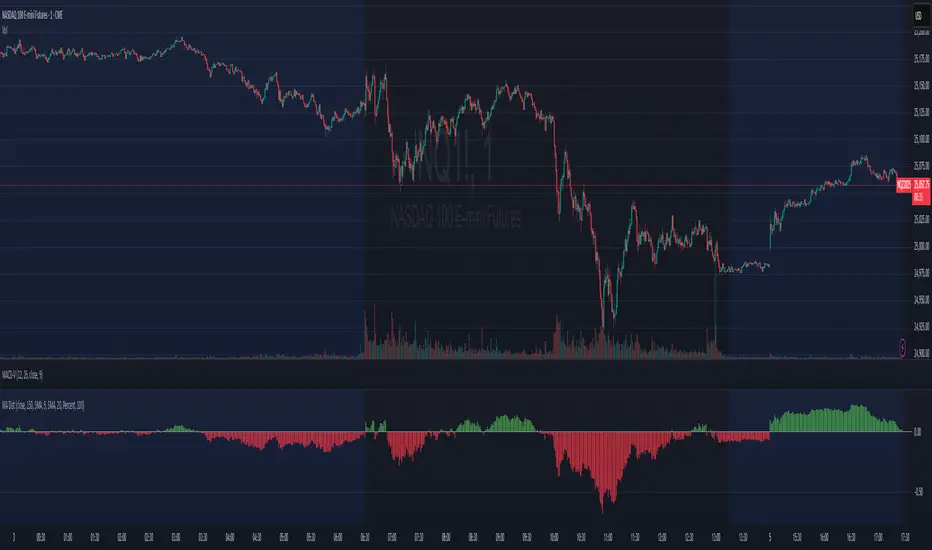
The distance from a moving average is a common way to look at how extended a stock is. This simplifies it a bit by plotting the distance below the chart, so you don't have to eyeball estimate it.
This indicator allows plotting the distance from 2 MAs, one is a histogram and one is a line.
The line MA is off by default.
The scale factor is in case you are using it intraday, it helps with small multiples of the Moving Average that would be common intraday.
"Scale by" lets you decide if the distance is measured as a percentage of the moving average level or as a count of ATRs.
受保護腳本
此腳本以閉源形式發佈。 不過,您可以自由且不受任何限制地使用它 — 在此處了解更多資訊。
免責聲明
這些資訊和出版物並不意味著也不構成TradingView提供或認可的金融、投資、交易或其他類型的意見或建議。請在使用條款閱讀更多資訊。
免責聲明
這些資訊和出版物並不意味著也不構成TradingView提供或認可的金融、投資、交易或其他類型的意見或建議。請在使用條款閱讀更多資訊。