OPEN-SOURCE SCRIPT
RSI Oversold Scanner
Pine Script Description for TradingView Publication
Title: RSI Oversold Scanner (1m, 5m, 15m)
Description:
The RSI Oversold Scanner is a powerful tool designed to identify stocks that are simultaneously oversold on the 1-minute, 5-minute, and 15-minute timeframes, based on the Relative Strength Index (RSI). This script is ideal for traders seeking short-term reversal or momentum opportunities across multiple intraday timeframes.
Key Features:
Multi-Timeframe RSI Analysis: Calculates RSI (default length: 14) on the 1m, 5m, and 15m timeframes and checks if all are below the oversold threshold (default: 30).
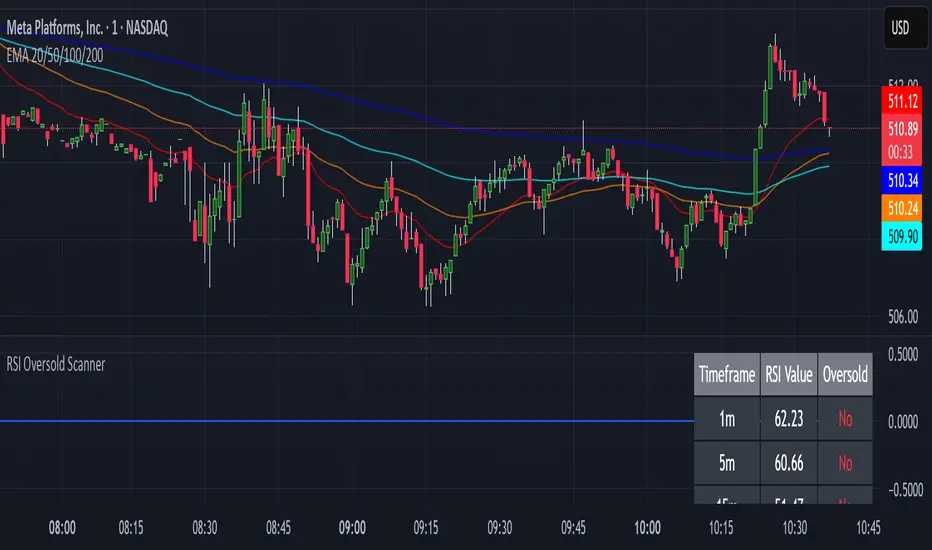
Visual Output: Displays a table in the top-right corner showing RSI values and oversold status ("Yes" or "No") for each timeframe, making it easy to verify conditions.
Scan Result: Plots a value of 1 when all three timeframes are oversold, or 0 otherwise, enabling quick identification of matching stocks.
Alert Support: Includes an alert condition that triggers when a stock is oversold on all timeframes, with a customizable message for real-time notifications.
User-Friendly: Built with Pine Script v6 for compatibility and reliability, with clear visual feedback for traders of all levels.
How It Works:
The script uses ta.rsi to compute RSI on the current chart’s timeframe (1m) and request.security to fetch RSI data for the 5m and 15m timeframes.
It checks if RSI is below the oversold level (default: 30) on all three timeframes.
A table displays the RSI values and oversold status for easy debugging.
The Scan Result plot (1 or 0) indicates whether the stock meets the oversold criteria, which can be used for manual scanning or alerts.
Usage Instructions:
Add the script to your chart via Pine Editor.
Use a watchlist to switch between stocks and check the table or Scan Result for oversold conditions.
Set alerts by selecting the script’s Scan Result condition (value = 1) to get notified when a stock is oversold on all timeframes.
Customize the RSI length or oversold level in the script’s code if needed (e.g., change rsiLength or oversoldLevel).
Notes:
Best used on intraday charts (e.g., 1m or higher) with a watchlist for manual scanning, as TradingView’s Stock Screener does not directly support custom Pine Scripts.
Real-time alerts and intraday data may require a TradingView paid plan.
The script uses only two request.security calls, staying well within Pine Script’s limits.
Ideal For:
Day traders and swing traders looking for oversold stocks across multiple intraday timeframes.
Users who want to combine technical analysis with visual and alert-based confirmation.
Title: RSI Oversold Scanner (1m, 5m, 15m)
Description:
The RSI Oversold Scanner is a powerful tool designed to identify stocks that are simultaneously oversold on the 1-minute, 5-minute, and 15-minute timeframes, based on the Relative Strength Index (RSI). This script is ideal for traders seeking short-term reversal or momentum opportunities across multiple intraday timeframes.
Key Features:
Multi-Timeframe RSI Analysis: Calculates RSI (default length: 14) on the 1m, 5m, and 15m timeframes and checks if all are below the oversold threshold (default: 30).
Visual Output: Displays a table in the top-right corner showing RSI values and oversold status ("Yes" or "No") for each timeframe, making it easy to verify conditions.
Scan Result: Plots a value of 1 when all three timeframes are oversold, or 0 otherwise, enabling quick identification of matching stocks.
Alert Support: Includes an alert condition that triggers when a stock is oversold on all timeframes, with a customizable message for real-time notifications.
User-Friendly: Built with Pine Script v6 for compatibility and reliability, with clear visual feedback for traders of all levels.
How It Works:
The script uses ta.rsi to compute RSI on the current chart’s timeframe (1m) and request.security to fetch RSI data for the 5m and 15m timeframes.
It checks if RSI is below the oversold level (default: 30) on all three timeframes.
A table displays the RSI values and oversold status for easy debugging.
The Scan Result plot (1 or 0) indicates whether the stock meets the oversold criteria, which can be used for manual scanning or alerts.
Usage Instructions:
Add the script to your chart via Pine Editor.
Use a watchlist to switch between stocks and check the table or Scan Result for oversold conditions.
Set alerts by selecting the script’s Scan Result condition (value = 1) to get notified when a stock is oversold on all timeframes.
Customize the RSI length or oversold level in the script’s code if needed (e.g., change rsiLength or oversoldLevel).
Notes:
Best used on intraday charts (e.g., 1m or higher) with a watchlist for manual scanning, as TradingView’s Stock Screener does not directly support custom Pine Scripts.
Real-time alerts and intraday data may require a TradingView paid plan.
The script uses only two request.security calls, staying well within Pine Script’s limits.
Ideal For:
Day traders and swing traders looking for oversold stocks across multiple intraday timeframes.
Users who want to combine technical analysis with visual and alert-based confirmation.
開源腳本
秉持TradingView一貫精神,這個腳本的創作者將其設為開源,以便交易者檢視並驗證其功能。向作者致敬!您可以免費使用此腳本,但請注意,重新發佈代碼需遵守我們的社群規範。
免責聲明
這些資訊和出版物並非旨在提供,也不構成TradingView提供或認可的任何形式的財務、投資、交易或其他類型的建議或推薦。請閱讀使用條款以了解更多資訊。
免責聲明
這些資訊和出版物並非旨在提供,也不構成TradingView提供或認可的任何形式的財務、投資、交易或其他類型的建議或推薦。請閱讀使用條款以了解更多資訊。