OPEN-SOURCE SCRIPT
Time Range
### Indicator Name: **Time Range**
#### Description:
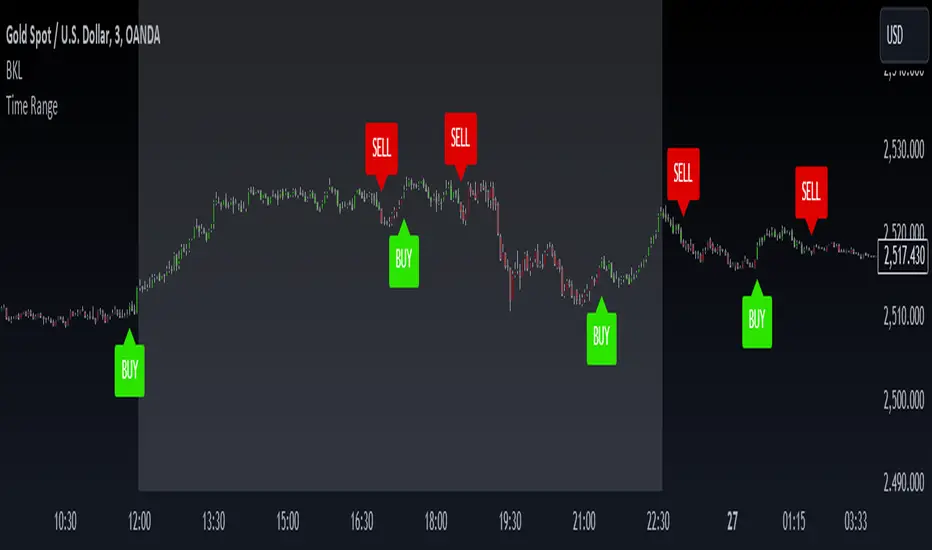
The **Time Range** indicator allows users to highlight specific time ranges on a chart for each day of the week. It uses customizable time inputs for every day (Monday to Sunday), allowing the user to define trading sessions or any time-based range. These sessions are visualized by shading the background of the chart within the defined periods.
#### Key Features:
- **Custom Sessions**: For each day of the week (Monday to Sunday), the user can define a unique time session by specifying the start time using the input fields.
- **Day-wise Session Activation**: The user can toggle the activation of sessions for each day by using checkboxes. If the session for a particular day is disabled, no background shading will appear for that day.
- **Background Highlighting**: When a session is active, the background of the chart during the specified session period will be shaded in gray with a 70% transparency. This helps the user visually identify active time ranges across multiple days.
#### Use Cases:
- **Highlighting Trading Sessions**: Traders can use this indicator to easily visualize specific market sessions such as the New York or London trading sessions.
- **Visualizing Custom Time Blocks**: Can be used to highlight any custom time blocks that are important for the trader, such as key trading hours, news release periods, or other time-based strategies.
#### Customizable Parameters:
- **Day Toggles**: Checkboxes to activate or deactivate sessions for each day of the week.
- **Time Range Inputs**: Time range inputs allow the user to set start times for each session, which are applied based on the user's selection for the day.
This indicator helps streamline chart analysis by giving clear visual markers for time-based events or trading windows.
#### Description:
The **Time Range** indicator allows users to highlight specific time ranges on a chart for each day of the week. It uses customizable time inputs for every day (Monday to Sunday), allowing the user to define trading sessions or any time-based range. These sessions are visualized by shading the background of the chart within the defined periods.
#### Key Features:
- **Custom Sessions**: For each day of the week (Monday to Sunday), the user can define a unique time session by specifying the start time using the input fields.
- **Day-wise Session Activation**: The user can toggle the activation of sessions for each day by using checkboxes. If the session for a particular day is disabled, no background shading will appear for that day.
- **Background Highlighting**: When a session is active, the background of the chart during the specified session period will be shaded in gray with a 70% transparency. This helps the user visually identify active time ranges across multiple days.
#### Use Cases:
- **Highlighting Trading Sessions**: Traders can use this indicator to easily visualize specific market sessions such as the New York or London trading sessions.
- **Visualizing Custom Time Blocks**: Can be used to highlight any custom time blocks that are important for the trader, such as key trading hours, news release periods, or other time-based strategies.
#### Customizable Parameters:
- **Day Toggles**: Checkboxes to activate or deactivate sessions for each day of the week.
- **Time Range Inputs**: Time range inputs allow the user to set start times for each session, which are applied based on the user's selection for the day.
This indicator helps streamline chart analysis by giving clear visual markers for time-based events or trading windows.
開源腳本
秉持TradingView一貫精神,這個腳本的創作者將其設為開源,以便交易者檢視並驗證其功能。向作者致敬!您可以免費使用此腳本,但請注意,重新發佈代碼需遵守我們的社群規範。
免責聲明
這些資訊和出版物並非旨在提供,也不構成TradingView提供或認可的任何形式的財務、投資、交易或其他類型的建議或推薦。請閱讀使用條款以了解更多資訊。
開源腳本
秉持TradingView一貫精神,這個腳本的創作者將其設為開源,以便交易者檢視並驗證其功能。向作者致敬!您可以免費使用此腳本,但請注意,重新發佈代碼需遵守我們的社群規範。
免責聲明
這些資訊和出版物並非旨在提供,也不構成TradingView提供或認可的任何形式的財務、投資、交易或其他類型的建議或推薦。請閱讀使用條款以了解更多資訊。