PROTECTED SOURCE SCRIPT
已更新 RVOL-Trading
Core Functionality
1. Dual RVOL Approach for Entry Confirmation
The script calculates two kinds of RVOLs for up to four intraday timeframes:
RVOL1 (based on daily average volume):
Formula: current intraday volume / 21-day SMA of daily volume
RVOL2 (based on same-timeframe average):
Formula: current intraday volume / average of past N intraday volumes (default 14)
The logic:
High RVOL1 → indicates unusual volume relative to daily historical averages.
High RVOL2 → indicates volume spike compared to typical activity at that timeframe.
2. Entry Signal – CheckGreen Condition
A bullish "Green" condition is triggered if:
Gap-up open (Opening_Price > 0)
Day’s low remains above previous close (strict lowCheck condition)
RVOL1 exceeds set thresholds (default 5% for 3m, 7% for 5m)
RVOL2 exceeds set thresholds (default 100%)
This is a strict entry filter, ensuring both price action and volume align.
💰 Position Sizing Logic
When enabled, the script calculates position size using three stop-loss methods:
Fixed SL % (e.g., 3%)
Day’s Low (LOD) below entry candle
Previous Day’s Low (PDL) below entry candle
🔢 Formula:
plaintext
Copy
Edit
Position Size = totalRisk / (entryPrice × stopLoss%)
Then it estimates position value as % of ₹1L capital (hardcoded).
Outputs include:
Number of shares
% distance to SL
Position size in lakhs (L)
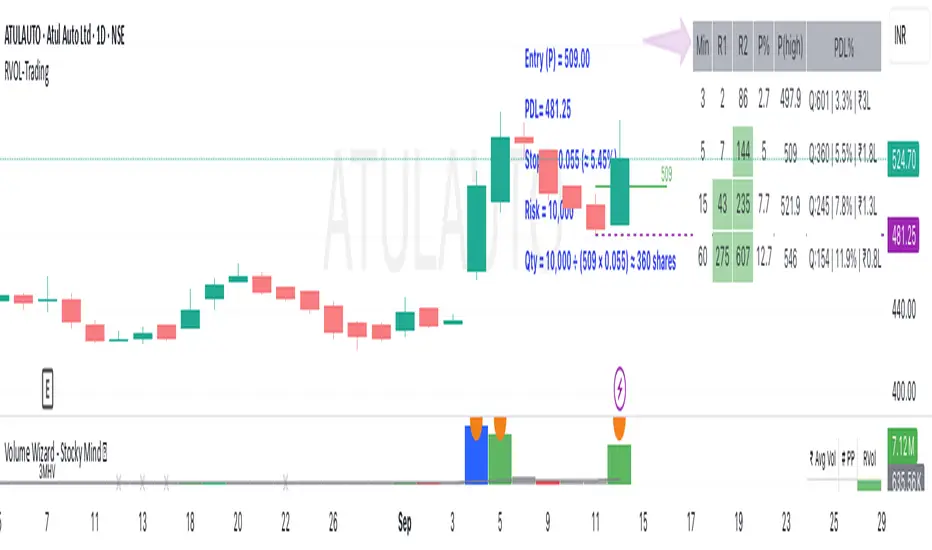
📋 RVOL Table Display
Displays in a table on the chart with the following columns:
Timeframe RVOL1 (%) RVOL2 (%) % Price Change Price SL % Position LOD-based Position PDL-based Position
Color coding helps identify which values meet thresholds.
📌 Customizable Inputs
✅ RVOL Inputs:
Days for SMA & historical volume (default: 21 & 14)
Timeframes: 3m, 5m, 15m, 60m (all configurable)
Thresholds for RVOL1, RVOL2, Gap %, and % price change
✅ Position Size Inputs:
Risk capital (default: ₹2500)
Enable/disable each SL type (SL %, LOD, PDL)
✅ Table Display:
Table size, color, location on chart
Enable/disable SL columns
🧩 Visual Elements
Draws horizontal levels for 5m/15m candle highs (if enabled)
Marks gap-up with a purple 'G' label
Color highlights on table cells for high RVOL or negative price moves
1. Dual RVOL Approach for Entry Confirmation
The script calculates two kinds of RVOLs for up to four intraday timeframes:
RVOL1 (based on daily average volume):
Formula: current intraday volume / 21-day SMA of daily volume
RVOL2 (based on same-timeframe average):
Formula: current intraday volume / average of past N intraday volumes (default 14)
The logic:
High RVOL1 → indicates unusual volume relative to daily historical averages.
High RVOL2 → indicates volume spike compared to typical activity at that timeframe.
2. Entry Signal – CheckGreen Condition
A bullish "Green" condition is triggered if:
Gap-up open (Opening_Price > 0)
Day’s low remains above previous close (strict lowCheck condition)
RVOL1 exceeds set thresholds (default 5% for 3m, 7% for 5m)
RVOL2 exceeds set thresholds (default 100%)
This is a strict entry filter, ensuring both price action and volume align.
💰 Position Sizing Logic
When enabled, the script calculates position size using three stop-loss methods:
Fixed SL % (e.g., 3%)
Day’s Low (LOD) below entry candle
Previous Day’s Low (PDL) below entry candle
🔢 Formula:
plaintext
Copy
Edit
Position Size = totalRisk / (entryPrice × stopLoss%)
Then it estimates position value as % of ₹1L capital (hardcoded).
Outputs include:
Number of shares
% distance to SL
Position size in lakhs (L)
📋 RVOL Table Display
Displays in a table on the chart with the following columns:
Timeframe RVOL1 (%) RVOL2 (%) % Price Change Price SL % Position LOD-based Position PDL-based Position
Color coding helps identify which values meet thresholds.
📌 Customizable Inputs
✅ RVOL Inputs:
Days for SMA & historical volume (default: 21 & 14)
Timeframes: 3m, 5m, 15m, 60m (all configurable)
Thresholds for RVOL1, RVOL2, Gap %, and % price change
✅ Position Size Inputs:
Risk capital (default: ₹2500)
Enable/disable each SL type (SL %, LOD, PDL)
✅ Table Display:
Table size, color, location on chart
Enable/disable SL columns
🧩 Visual Elements
Draws horizontal levels for 5m/15m candle highs (if enabled)
Marks gap-up with a purple 'G' label
Color highlights on table cells for high RVOL or negative price moves
發行說明
Enhance the formatting of the Table 受保護腳本
此腳本以閉源形式發佈。 不過,您可以自由使用,沒有任何限制 — 點擊此處了解更多。
免責聲明
這些資訊和出版物並非旨在提供,也不構成TradingView提供或認可的任何形式的財務、投資、交易或其他類型的建議或推薦。請閱讀使用條款以了解更多資訊。
受保護腳本
此腳本以閉源形式發佈。 不過,您可以自由使用,沒有任何限制 — 點擊此處了解更多。
免責聲明
這些資訊和出版物並非旨在提供,也不構成TradingView提供或認可的任何形式的財務、投資、交易或其他類型的建議或推薦。請閱讀使用條款以了解更多資訊。