OPEN-SOURCE SCRIPT
Percent from And To All Time High,
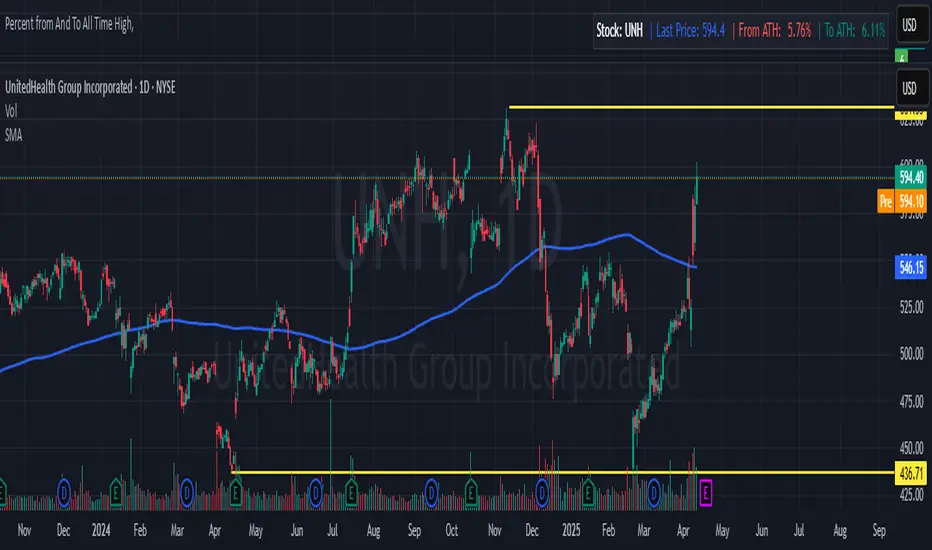
Indicator: Percent from All Time High - Raised Label
Overview:
This indicator shows the percentage difference between the current price of an asset and its all-time high (ATH). It displays these percentages in a raised label at the top of the chart. Additionally, the last price and the percentage difference to ATH are displayed in a table.
Features:
Displays the percentage difference from ATH (From ATH) and the percentage difference to ATH (To ATH) in a table.
The Last Price is shown along with the percentage difference.
The data is dynamically updated with the current price, and it will always show the latest information.
Visualizes price movements with colored bars to indicate price direction.
開源腳本
秉持TradingView一貫精神,這個腳本的創作者將其設為開源,以便交易者檢視並驗證其功能。向作者致敬!您可以免費使用此腳本,但請注意,重新發佈代碼需遵守我們的社群規範。
免責聲明
這些資訊和出版物並非旨在提供,也不構成TradingView提供或認可的任何形式的財務、投資、交易或其他類型的建議或推薦。請閱讀使用條款以了解更多資訊。
開源腳本
秉持TradingView一貫精神,這個腳本的創作者將其設為開源,以便交易者檢視並驗證其功能。向作者致敬!您可以免費使用此腳本,但請注意,重新發佈代碼需遵守我們的社群規範。
免責聲明
這些資訊和出版物並非旨在提供,也不構成TradingView提供或認可的任何形式的財務、投資、交易或其他類型的建議或推薦。請閱讀使用條款以了解更多資訊。