OPEN-SOURCE SCRIPT
Chaikin Volume Accumulator
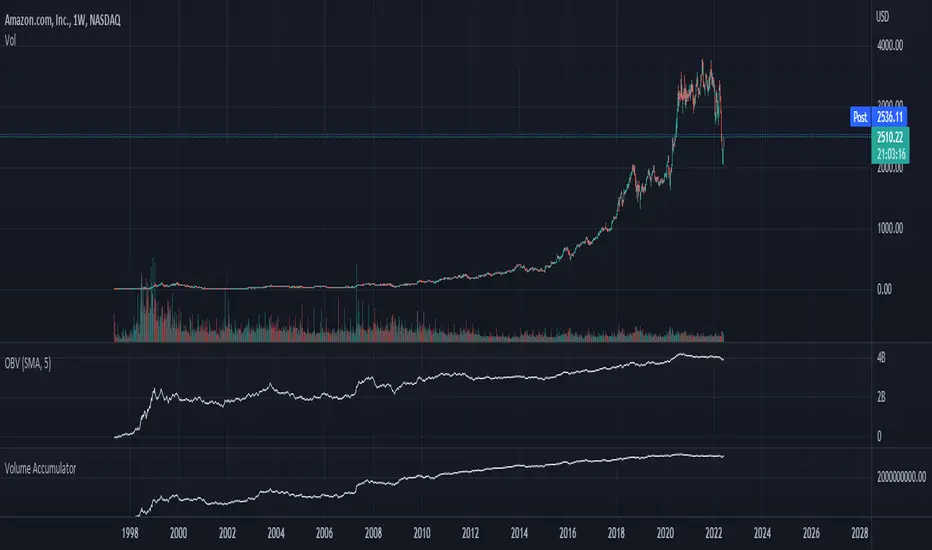
The Volume Accumulator is used in technical analysis to identify strengths and weaknesses in a market. It is derived from the On Balance Volume indicator, except that instead of giving all the volume to bears on red days and bulls on green days it gives a proportional amount to both depending on the relative close price. As with many trading indicators, classic divergence between the VA and the close price may indicate an incoming reversal.
As a general rule of thumb:
Price Up:
VA up = clear uptrend
VA sideways = moderate uptrend
VA down = weak uptrend
Price Sideways:
VA up = accumulation
VA sideways = no bias
VA down = distribution
Price Down
VA up = weak downtrend
VA sideways = moderate downtrend
VA down = strong downtrend
As a general rule of thumb:
Price Up:
VA up = clear uptrend
VA sideways = moderate uptrend
VA down = weak uptrend
Price Sideways:
VA up = accumulation
VA sideways = no bias
VA down = distribution
Price Down
VA up = weak downtrend
VA sideways = moderate downtrend
VA down = strong downtrend
開源腳本
秉持TradingView一貫精神,這個腳本的創作者將其設為開源,以便交易者檢視並驗證其功能。向作者致敬!您可以免費使用此腳本,但請注意,重新發佈代碼需遵守我們的社群規範。
免責聲明
這些資訊和出版物並非旨在提供,也不構成TradingView提供或認可的任何形式的財務、投資、交易或其他類型的建議或推薦。請閱讀使用條款以了解更多資訊。
開源腳本
秉持TradingView一貫精神,這個腳本的創作者將其設為開源,以便交易者檢視並驗證其功能。向作者致敬!您可以免費使用此腳本,但請注意,重新發佈代碼需遵守我們的社群規範。
免責聲明
這些資訊和出版物並非旨在提供,也不構成TradingView提供或認可的任何形式的財務、投資、交易或其他類型的建議或推薦。請閱讀使用條款以了解更多資訊。