OPEN-SOURCE SCRIPT
Stochastic/LSMA
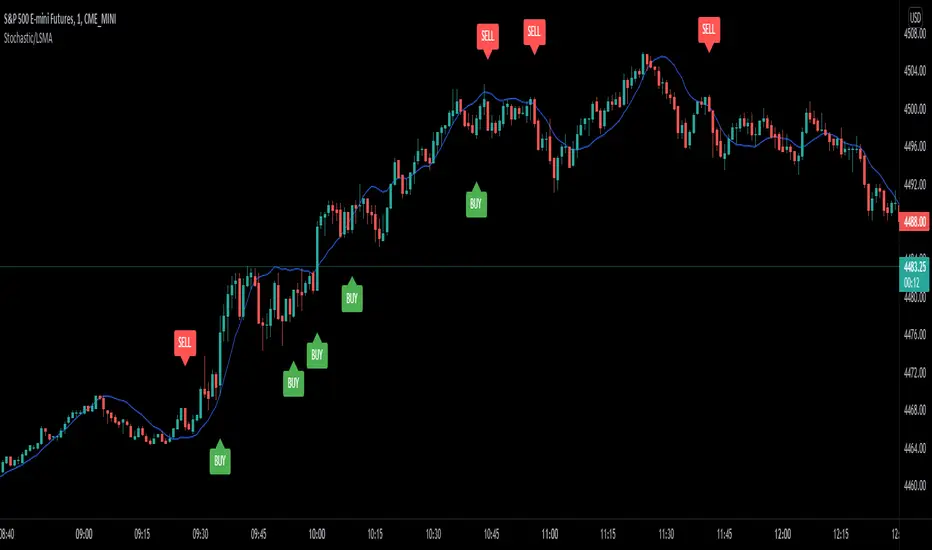
This is the Stochastic/LSMA Buy and Sell indicator. The Buy signal is generated when the %K line crosses up above the %D line from the stochastics while the signal candle is green and has come after a red candle. The Sell signal is generated when the %K line crosses down below the %D line from the stochastics while the signal candle is red and has come after a green candle. The default settings are %K Length is 5, the %K Smoothing is 3, and the %D Smoothing is 3 with the LSMA period being 30. I use this indicator to scalp 2 points at a time on the E-Mini (ES) on a 1 minute timeframe. I like to use a stop loss of 2 points and a target of 2 points. The LSMA helps to reduce fake signals and should also be used to see the overall trend. I hope this helps.
開源腳本
秉持TradingView一貫精神,這個腳本的創作者將其設為開源,以便交易者檢視並驗證其功能。向作者致敬!您可以免費使用此腳本,但請注意,重新發佈代碼需遵守我們的社群規範。
免責聲明
這些資訊和出版物並非旨在提供,也不構成TradingView提供或認可的任何形式的財務、投資、交易或其他類型的建議或推薦。請閱讀使用條款以了解更多資訊。
開源腳本
秉持TradingView一貫精神,這個腳本的創作者將其設為開源,以便交易者檢視並驗證其功能。向作者致敬!您可以免費使用此腳本,但請注意,重新發佈代碼需遵守我們的社群規範。
免責聲明
這些資訊和出版物並非旨在提供,也不構成TradingView提供或認可的任何形式的財務、投資、交易或其他類型的建議或推薦。請閱讀使用條款以了解更多資訊。