INVITE-ONLY SCRIPT
已更新 MCumulativeDelta
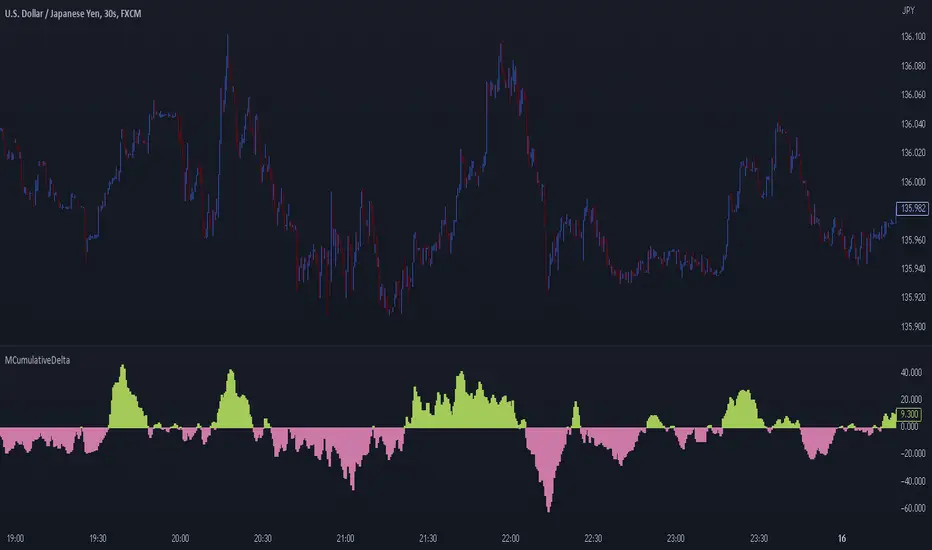
* MCumulativeDelta Indicator *
The MCumulativeDelta Indicator shows the Buying / Selling pressure that is happening in the market. The Delta is powered by the *MBox Precision Delta* Algorithm. This indicator serves to show overall Accumulation and Distribution of the BUYERS and the SELLERS. It becomes possible to gauge if the market is overall Bullish or Bearish. This helps determine trade direction and keeping out of other trades that are counter to what the overall Buying / Selling is showing.
* WHAT THE SCRIPT DOES *
The script draws a histogram that can either be positive or negative. When the histogram is positive it means there are more Buyers in the Market. When the histogram is negative it means there are more sellers in the market. The more positive the histogram gets, the more BUYERS are flooding the market. The more negative the histogram gets, the more SELLERS are flooding the market. When the histogram switches over from negative to positive it is a Bullish sign of Buying. When the histogram switches over from positive to negative, it is a Bearish sign of Selling.
* HOW TO USE IT *
As the histogram becomes more negative, this shows that the SELLERS have taken control of the markets. Conversely, as the histogram becomes more positive, this shows that the Buyers have taken control of the markets. The side that is in control is the direction to generally place trades in, and at the same time filter out trades of the opposite direction.
* HOW IT WORKS *
The MCumulativeDelta histogram on the chart represents overall Buying / Selling. This is the DELTA (difference) between the BUYING and the SELLING. Taking the total BUYING and subtracting the total of SELLING, we produce the DELTA (difference) between the Buying / Selling and this is what is drawn by the histogram.
Unlike other Cumulative Delta indicators which determine delta from the Up / Down wick and just multiply by volume (not a true delta), the MCumulativeDelta indicator uses a sophisticated algorithm that analyzes price movement corresponding to volume movement.
The way the DELTA, BUYING, and SELLING is calculated is computed by the *MBox Precision Delta* Algorithm. The algorithm considers the following data points when making it's computation
1. Price moving up on increasing volume
2. Price moving up on decreasing volume
3. Price moving horizontally on increasing volume
4. Price moving horizontally on decreasing volume
5. Price moving down on increasing volume
6. Price moving down on decreasing volume
Using these data points allows MCumulativeDelta to effectively compute and define the following scenarios
1. Accumulation / Distribution
2. Buying / Selling Exhaustion
3. Buying / Selling EFFORT / NO RESULT
Once the scenario is determined, it will greatly aid in trade decision making. These scenarios are explained in the examples below
* EXAMPLE AND USE CASES *
- Accumulation Example -
When you see a large amount of BUYING (large positive histogram) and price entering an up trend, this is indicative of Accumulation and you would be looking for PULLBACKS to get into the up trend move.
- Distribution Example -
When you see a large amount of SELLING (large negative histogram) and price entering a down trend, this is indicative of Distribution and you would be looking for pullbacks to get into the down trend move.
- Buying EXHAUSTION Divergence -
As price makes higher highs, but the MCumulativeDelta histogram drops (becomes less positive) on the higher highs, it means BUYERS are exhausted. Potentially a reversal or change in behavior in the markets.
- Selling EXHAUSTION Divergence -
As price makes lower lows, but the MCumulativeDelta histogram contracts (becomes less negative) on the lower lows, it means SELLERS are exhausted. Potentially a reversal or change in behavior in the markets.
- BUYING EFFORT / NO RESULT -
As the MCumulativeDelta histogram increases positively, but price fails to make higher highs, it is a sign of EFFORT / NO RESULT on behalf of the Buyers. In this case Buyers are pushing hard to move price up, but are unable to, due to being OVERBOUGHT. If this is accompanied by visible SELLING, it would be a good short entry.
- SELLING EFFORT / NO RESULT -
As the MCumulativeDelta histogram increases negatively, but price fails to make lower lows, it is a sign of EFFORT / NO RESULT on behalf of the Sellers. In this case Sellers are pushing hard to move price down, but are unable to, due to being OVERSOLD. If this is accompanied by visible BUYING, it would be a good long entry.
* SETTING ALERTS *
- FOR CROSSING FROM BUYING TO SELLING OR SELLING TO BUYING -
To be alerted when the histogram crosses over from Buying to Selling (Positive to Negative) or Selling to Buying (Negative to Positive)
1. Right Click Chart -> Add Alert...
2. Select Condition to be "MCumulativeDelta"
3. Select "Crossing" with Value = 0
4. Options set "Once Per Bar Close"
5. Customize Any other Alert Options you want
* AUTHOR *
This script is published by MBoxWave LLC
發行說明
Added "MBidAskOscillator Mode", which will show Bid and Ask separately instead of the Delta僅限邀請腳本
僅作者批准的使用者才能訪問此腳本。您需要申請並獲得使用許可,通常需在付款後才能取得。更多詳情,請依照作者以下的指示操作,或直接聯絡mboxwave。
TradingView不建議在未完全信任作者並了解其運作方式的情況下購買或使用腳本。您也可以在我們的社群腳本中找到免費的開源替代方案。
作者的說明
Purchase / Additional information about MBoxWave TradingView Indicators on this page
https://mboxwave.com/tradingview
Get in contact with me via the contact form
https://mboxwave.com/contact-form
Purchase / Additional information about MBoxWave TradingView Indicators on this page
mboxwave.com/tradingview
Get in contact with me via the contact form
mboxwave.com/contact-form
mboxwave.com/tradingview
Get in contact with me via the contact form
mboxwave.com/contact-form
免責聲明
這些資訊和出版物並非旨在提供,也不構成TradingView提供或認可的任何形式的財務、投資、交易或其他類型的建議或推薦。請閱讀使用條款以了解更多資訊。
僅限邀請腳本
僅作者批准的使用者才能訪問此腳本。您需要申請並獲得使用許可,通常需在付款後才能取得。更多詳情,請依照作者以下的指示操作,或直接聯絡mboxwave。
TradingView不建議在未完全信任作者並了解其運作方式的情況下購買或使用腳本。您也可以在我們的社群腳本中找到免費的開源替代方案。
作者的說明
Purchase / Additional information about MBoxWave TradingView Indicators on this page
https://mboxwave.com/tradingview
Get in contact with me via the contact form
https://mboxwave.com/contact-form
Purchase / Additional information about MBoxWave TradingView Indicators on this page
mboxwave.com/tradingview
Get in contact with me via the contact form
mboxwave.com/contact-form
mboxwave.com/tradingview
Get in contact with me via the contact form
mboxwave.com/contact-form
免責聲明
這些資訊和出版物並非旨在提供,也不構成TradingView提供或認可的任何形式的財務、投資、交易或其他類型的建議或推薦。請閱讀使用條款以了解更多資訊。