OPEN-SOURCE SCRIPT
已更新 Wave Anchor Indicator
The Wave Anchor Indicator is designed to mark the crossing of overbought and oversold levels of higher time frame momentum waves, based on the VuManChu Cipher B+Divergences Wave Trend Indicator. This tool is inspired by the TP Mint trading strategy, which relies heavily on the momentum waves of Market Cipher B or VuManChu Cipher B for identifying optimal entry and exit points.
Key Concept: Anchored Waves
In the TP Mint strategy, momentum waves in overbought (above 60) or oversold (below -60) conditions on higher time frames are considered "anchored." These anchored waves provide strong signals for entries and take-profit points when viewed on lower time frames. The Wave Anchor Indicator focuses on these anchor conditions to help traders make informed decisions by seeing higher time frame anchor states directly on the entry time frame chart.
How It Works
Labeling Signals:
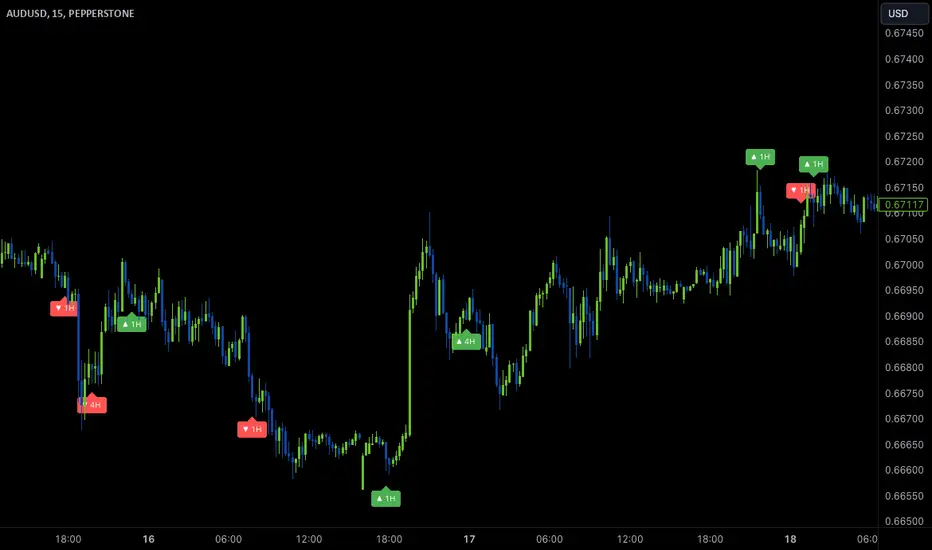
- On lower time frames, such as the 15-minute chart, the indicator shows labels when higher
time frame momentum waves (1-hour and 4-hour) cross the overbought or oversold levels.
- Labels above price indicate overbought conditions, with green labels when the wave crosses
upward and red labels when crossing downward.
- Labels below price signal oversold conditions, with red for a downward cross and green for an
upward cross.
- Each label displays the time frame of the crossing momentum wave, providing context for
traders at a glance.
Time Frame Pairings:
- On the 15-minute time frame, the indicator tracks anchor conditions from the 1-hour and 4-
hour time frames.
- On the 1-hour chart, it monitors 4-hour and daily time frame anchor conditions.
Customization and Alerts
Flexible Display Options: Users can choose to display none, one, or both of the grouped higher time frame labels, depending on their strategy and preferences.
Alerts: The indicator also allows for custom alerts when a label appears, helping traders stay on top of key market movements without constantly monitoring the chart.
Use Cases
This indicator is ideal for traders who use momentum-based strategies across multiple time frames. It simplifies the process of identifying key entry and exit points by focusing on the anchor conditions from higher time frames, making it easier to execute the TP Mint strategy or similar methods.
Thank you to VuManChu and LazyBear for mamking the momentum wave code open source and allowing it’s use in this indicator.
Key Concept: Anchored Waves
In the TP Mint strategy, momentum waves in overbought (above 60) or oversold (below -60) conditions on higher time frames are considered "anchored." These anchored waves provide strong signals for entries and take-profit points when viewed on lower time frames. The Wave Anchor Indicator focuses on these anchor conditions to help traders make informed decisions by seeing higher time frame anchor states directly on the entry time frame chart.
How It Works
Labeling Signals:
- On lower time frames, such as the 15-minute chart, the indicator shows labels when higher
time frame momentum waves (1-hour and 4-hour) cross the overbought or oversold levels.
- Labels above price indicate overbought conditions, with green labels when the wave crosses
upward and red labels when crossing downward.
- Labels below price signal oversold conditions, with red for a downward cross and green for an
upward cross.
- Each label displays the time frame of the crossing momentum wave, providing context for
traders at a glance.
Time Frame Pairings:
- On the 15-minute time frame, the indicator tracks anchor conditions from the 1-hour and 4-
hour time frames.
- On the 1-hour chart, it monitors 4-hour and daily time frame anchor conditions.
Customization and Alerts
Flexible Display Options: Users can choose to display none, one, or both of the grouped higher time frame labels, depending on their strategy and preferences.
Alerts: The indicator also allows for custom alerts when a label appears, helping traders stay on top of key market movements without constantly monitoring the chart.
Use Cases
This indicator is ideal for traders who use momentum-based strategies across multiple time frames. It simplifies the process of identifying key entry and exit points by focusing on the anchor conditions from higher time frames, making it easier to execute the TP Mint strategy or similar methods.
Thank you to VuManChu and LazyBear for mamking the momentum wave code open source and allowing it’s use in this indicator.
發行說明
Release NotesVersion 10.23.24 r55
• Changed label shapes and added text arrow to label to clarify direction of wave cross
• Alert text changed for clarity
• Label offset increased to reduce overlap with candles
開源腳本
秉持TradingView一貫精神,這個腳本的創作者將其設為開源,以便交易者檢視並驗證其功能。向作者致敬!您可以免費使用此腳本,但請注意,重新發佈代碼需遵守我們的社群規範。
免責聲明
這些資訊和出版物並非旨在提供,也不構成TradingView提供或認可的任何形式的財務、投資、交易或其他類型的建議或推薦。請閱讀使用條款以了解更多資訊。
免責聲明
這些資訊和出版物並非旨在提供,也不構成TradingView提供或認可的任何形式的財務、投資、交易或其他類型的建議或推薦。請閱讀使用條款以了解更多資訊。