OPEN-SOURCE SCRIPT
Fib top and bottom Hunter - No Repaint
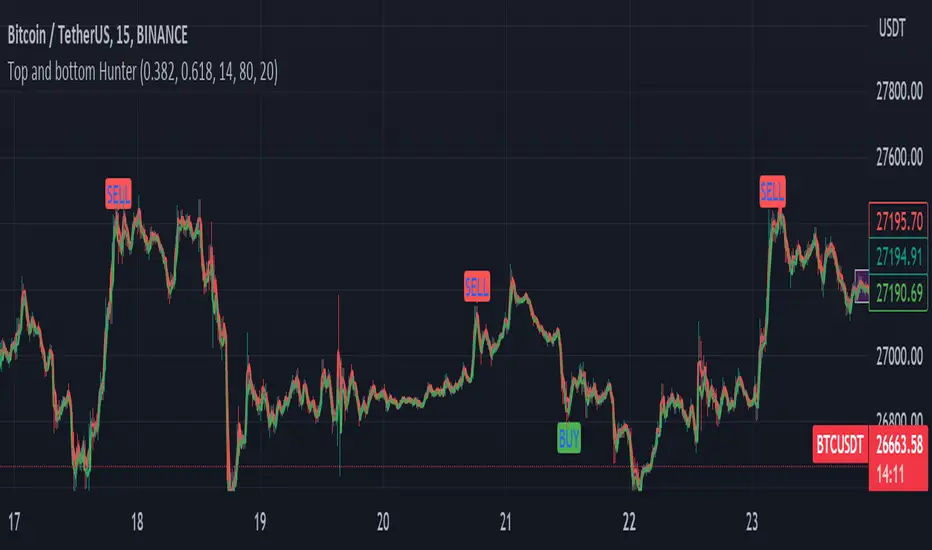
"Top and bottom Hunter" indicator combines two popular technical analysis tools, Fibonacci retracement levels and the Relative Strength Index (RSI), to identify potential trading opportunities in the market.
Fibonacci retracement levels are based on the Fibonacci sequence, a mathematical series where each number is the sum of the two preceding ones. In trading, Fibonacci retracement levels are used to identify potential support and resistance levels based on the recent price action. The indicator uses two Fibonacci levels, fib_0 and fib_1, which are typically set to 0.382 and 0.618, respectively. These levels represent common retracement ratios.
To calculate the Fibonacci levels, the indicator considers the highest and lowest prices within a specified range, typically the highest and lowest of the last two bars. It calculates the fib_range, which is the difference between the highest and lowest prices. Then, fib_level_0 and fib_level_1 are determined by subtracting the Fibonacci ratios from the highest price.
The RSI is a momentum oscillator that measures the speed and change of price movements. It helps identify overbought and oversold conditions in the market. The RSI parameters used in this indicator are rsi_length (length of the RSI calculation), rsi_overbought (upper threshold indicating overbought conditions), and rsi_oversold (lower threshold indicating oversold conditions). The RSI value is calculated based on the closing prices.
The indicator generates buy and sell signals based on specific conditions:
Buy Condition: A buy signal is triggered when the RSI crosses above the oversold level (rsi_oversold) and the closing price is higher than fib_level_1. This indicates a potential reversal or bounce from the Fibonacci support level.
Sell Condition: A sell signal is triggered when the RSI crosses below the overbought level (rsi_overbought) and the closing price is lower than fib_level_0. This suggests a potential reversal or pullback from the Fibonacci resistance level.
In summary, this indicator combines the power of Fibonacci retracement levels and the RSI to identify potential trading opportunities. It helps traders find confluence between the Fibonacci support or resistance levels and the RSI readings, indicating potential trend reversals or bounces. Traders can use this information to make informed decisions about entering or exiting positions in the market.
Feel free to change the settings for what works best for you and use this with other confluences. I personally use RSI overbought and oversold values as 80 and 20
開源腳本
本著TradingView的真正精神,此腳本的創建者將其開源,以便交易者可以查看和驗證其功能。向作者致敬!雖然您可以免費使用它,但請記住,重新發佈程式碼必須遵守我們的網站規則。
免責聲明
這些資訊和出版物並不意味著也不構成TradingView提供或認可的金融、投資、交易或其他類型的意見或建議。請在使用條款閱讀更多資訊。
開源腳本
本著TradingView的真正精神,此腳本的創建者將其開源,以便交易者可以查看和驗證其功能。向作者致敬!雖然您可以免費使用它,但請記住,重新發佈程式碼必須遵守我們的網站規則。
免責聲明
這些資訊和出版物並不意味著也不構成TradingView提供或認可的金融、投資、交易或其他類型的意見或建議。請在使用條款閱讀更多資訊。