INVITE-ONLY SCRIPT
Trend Ladder Pro
Trend Ladder Pro
Detail Explanation:
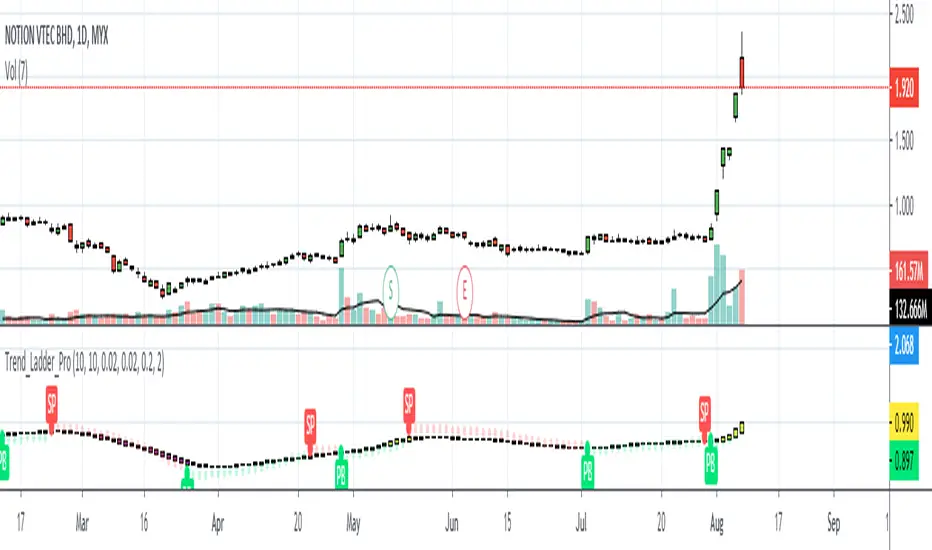
1. Purple Ladder
- Indicate that the market share is in a bearish trend. The ladder is heikin ashi candle which gives the smoother and uninterrupted downtrend.
2. Yellow Ladder
- Indicate that the market share is in a bullish trend. The ladder is heikin ashi candle which gives the smoother and uninterrupted uptrend.
3. Selling Pressure(SP)
- This signal shows that the selling pressure starting to take over the market shares. It appear when the first dot triggered to warn the traders from entering the market share or to take profit if they already holding position.
4. Pullback(PB)
- This signal shows that traders starting to have an interest in the market shares and having a pullback signal. It appear when the first dot triggered to alert the traders so that the market share can be put in the watchlist.
5. Red and Green Dot
- These dots are Parabolic SAR with the default setting but custom colors depending on the user interest. The dots are below as the price moving uptrend and above when the price downtrend. However, during sideways there will be a lot of false signals.
Contact me if you want to try the indicator.
Detail Explanation:
1. Purple Ladder
- Indicate that the market share is in a bearish trend. The ladder is heikin ashi candle which gives the smoother and uninterrupted downtrend.
2. Yellow Ladder
- Indicate that the market share is in a bullish trend. The ladder is heikin ashi candle which gives the smoother and uninterrupted uptrend.
3. Selling Pressure(SP)
- This signal shows that the selling pressure starting to take over the market shares. It appear when the first dot triggered to warn the traders from entering the market share or to take profit if they already holding position.
4. Pullback(PB)
- This signal shows that traders starting to have an interest in the market shares and having a pullback signal. It appear when the first dot triggered to alert the traders so that the market share can be put in the watchlist.
5. Red and Green Dot
- These dots are Parabolic SAR with the default setting but custom colors depending on the user interest. The dots are below as the price moving uptrend and above when the price downtrend. However, during sideways there will be a lot of false signals.
Contact me if you want to try the indicator.
僅限邀請腳本
僅作者批准的使用者才能訪問此腳本。您需要申請並獲得使用許可,通常需在付款後才能取得。更多詳情,請依照作者以下的指示操作,或直接聯絡Trader_Cenonet。
TradingView不建議在未完全信任作者並了解其運作方式的情況下購買或使用腳本。您也可以在我們的社群腳本中找到免費的開源替代方案。
作者的說明
免責聲明
這些資訊和出版物並非旨在提供,也不構成TradingView提供或認可的任何形式的財務、投資、交易或其他類型的建議或推薦。請閱讀使用條款以了解更多資訊。
僅限邀請腳本
僅作者批准的使用者才能訪問此腳本。您需要申請並獲得使用許可,通常需在付款後才能取得。更多詳情,請依照作者以下的指示操作,或直接聯絡Trader_Cenonet。
TradingView不建議在未完全信任作者並了解其運作方式的情況下購買或使用腳本。您也可以在我們的社群腳本中找到免費的開源替代方案。
作者的說明
免責聲明
這些資訊和出版物並非旨在提供,也不構成TradingView提供或認可的任何形式的財務、投資、交易或其他類型的建議或推薦。請閱讀使用條款以了解更多資訊。