OPEN-SOURCE SCRIPT
Trampoline Dots
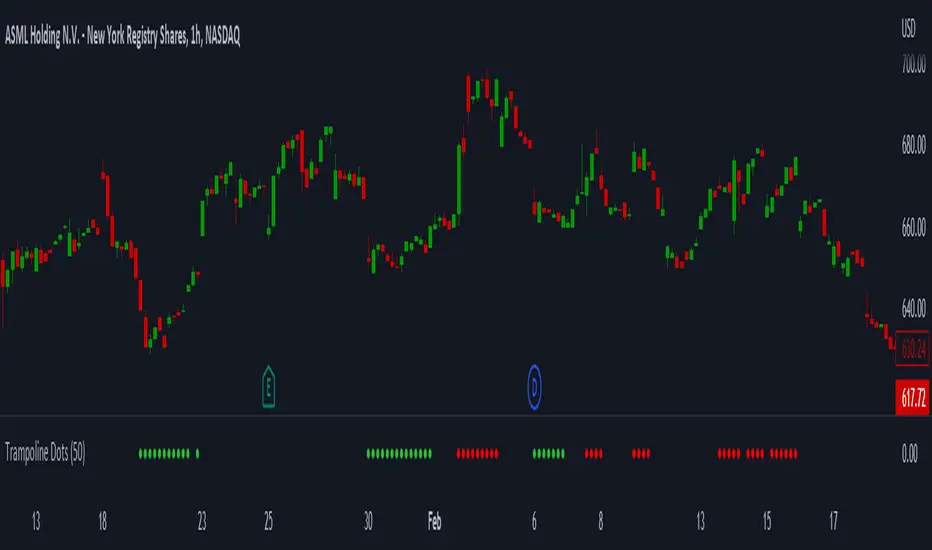
Trampoline Dots (Price Divergence)
Higher Time Frame Price Divergence:
Trampoline Dots serve as a "quick bounce" tool. These little dots will trigger whenever the higher aggregation MACD is above / below zero and the price is below / above the 50 period simple moving average. When these criteria are met, the price is usually under pressure of strong divergence, more often than not price will sharply reverse into the trend direction usually within the next few bars.
The Use of The Trampoline Dots:
This indicator can serve multiple ways. Obviously the main use case is the price divergence. These "dots" will not give you any precise & exact entry. But rather a zone of possible incoming reversal. There is no timing to it. All these dots will do is warn you about potential sharp reversal in the upcoming bars. It can be used by itself alone for sure, but the best way to utilize the dots is to use them in combination of other trend or momentum studies. The best signals are the ones that are within the larger time frame trend. Another great thing is that the visuals are really straight-forward and simple. It is either green dot or a red dot. Nothing more, nothing less. Also since the indicator is pretty small, it can be easily layered onto other studies as well which can create an additional confirmation for different patterns or setups.
Which Time Frame Are Reliable?
This indicator works on any time frame. But the most "stable" one is the daily & hourly time frame. My personal favorite is the hourly since these divergences can produce amazing entries in the daily trends (which are usually hidden on the daily chart). In the most aggresive trends, I like to see the green dots triggering around the 8 EMA and 13 EMA. Daily chart can show the daily and weekly (big divergences) that can take multiple days & weeks to resolve.
Hope it helps.
開源腳本
本著TradingView的真正精神,此腳本的創建者將其開源,以便交易者可以查看和驗證其功能。向作者致敬!雖然您可以免費使用它,但請記住,重新發佈程式碼必須遵守我們的網站規則。
免責聲明
這些資訊和出版物並不意味著也不構成TradingView提供或認可的金融、投資、交易或其他類型的意見或建議。請在使用條款閱讀更多資訊。
開源腳本
本著TradingView的真正精神,此腳本的創建者將其開源,以便交易者可以查看和驗證其功能。向作者致敬!雖然您可以免費使用它,但請記住,重新發佈程式碼必須遵守我們的網站規則。
免責聲明
這些資訊和出版物並不意味著也不構成TradingView提供或認可的金融、投資、交易或其他類型的意見或建議。請在使用條款閱讀更多資訊。