OPEN-SOURCE SCRIPT
JADUGAAR_GORACHAND_V2
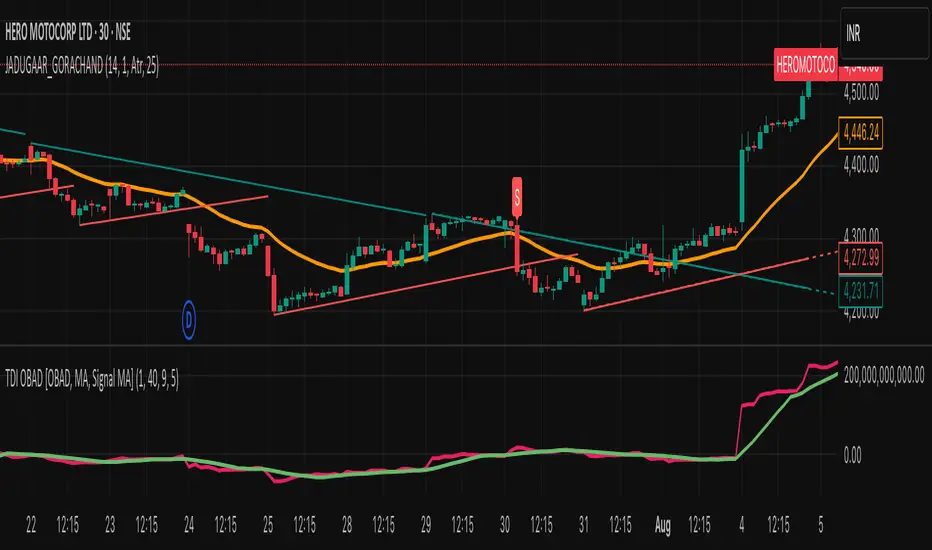
1. What is a Trendline?
A trendline is a straight line drawn on a chart that connects two or more price points. It helps visualize the direction and strength of a trend — uptrend, downtrend, or sideways.
🔼 2. Uptrend Line
An uptrend line connects higher lows. It acts as a support level, suggesting that buyers are in control. Price tends to bounce upward off this line during a bullish trend.
🔽 3. Downtrend Line
A downtrend line connects lower highs. It acts as a resistance level, indicating that sellers dominate. Price tends to fall after touching this line in a bearish trend.
🔄 4. Trendline Breaks
When price breaks a trendline, it may signal a potential trend reversal or trend weakening. Traders often use this for entry or exit signals.
📊 5. Trendline Validity
A trendline is more reliable when:
It touches 3 or more points
It's drawn over a longer time frame
There's strong volume on the breakout
開源腳本
秉持TradingView一貫精神,這個腳本的創作者將其設為開源,以便交易者檢視並驗證其功能。向作者致敬!您可以免費使用此腳本,但請注意,重新發佈代碼需遵守我們的社群規範。
免責聲明
這些資訊和出版物並非旨在提供,也不構成TradingView提供或認可的任何形式的財務、投資、交易或其他類型的建議或推薦。請閱讀使用條款以了解更多資訊。
開源腳本
秉持TradingView一貫精神,這個腳本的創作者將其設為開源,以便交易者檢視並驗證其功能。向作者致敬!您可以免費使用此腳本,但請注意,重新發佈代碼需遵守我們的社群規範。
免責聲明
這些資訊和出版物並非旨在提供,也不構成TradingView提供或認可的任何形式的財務、投資、交易或其他類型的建議或推薦。請閱讀使用條款以了解更多資訊。