OPEN-SOURCE SCRIPT
Simple Monthly Seasonality
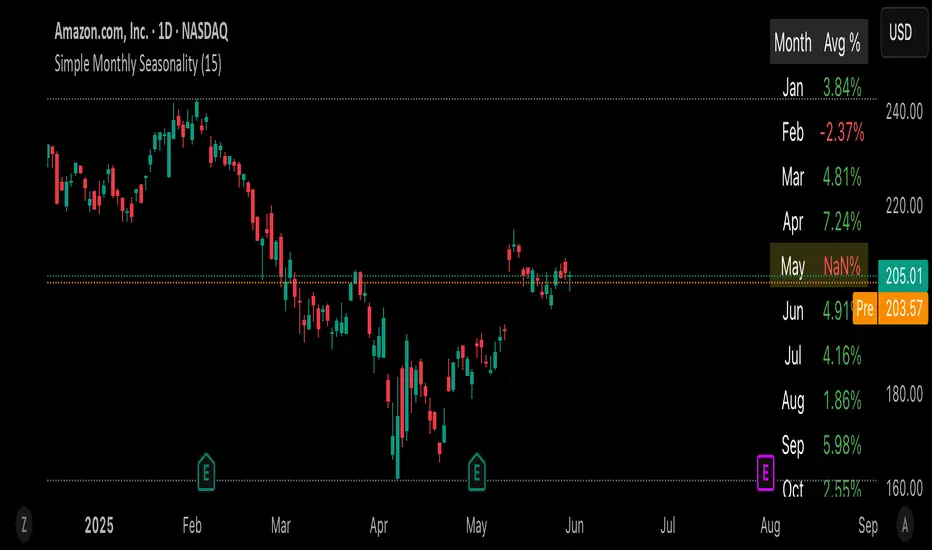
This script helps traders quickly visualize how an asset performs month by month over a customizable historical period.
🔍 What it does:
• Calculates average monthly returns over the past N years (default: 15).
• Highlights the current month for quick context.
• Displays results in a clean 2-column table (Month | Avg % Return).
💡 Features:
• Works on any timeframe – internally pulls monthly data.
• Color-coded performance (green for positive, red for negative).
• Dynamic highlights – the current month is softly emphasized.
• Fully customizable lookback period (1–50 years).
📈 Use cases:
• Spot seasonal market trends.
• Time entries/exits based on recurring historical strength/weakness.
• Build the foundation for more advanced seasonality or macro scripts.
Just load it on any chart and see which months historically outshine the rest.
⸻
開源腳本
本著TradingView的真正精神,此腳本的創建者將其開源,以便交易者可以查看和驗證其功能。向作者致敬!雖然您可以免費使用它,但請記住,重新發佈程式碼必須遵守我們的網站規則。
免責聲明
這些資訊和出版物並不意味著也不構成TradingView提供或認可的金融、投資、交易或其他類型的意見或建議。請在使用條款閱讀更多資訊。
開源腳本
本著TradingView的真正精神,此腳本的創建者將其開源,以便交易者可以查看和驗證其功能。向作者致敬!雖然您可以免費使用它,但請記住,重新發佈程式碼必須遵守我們的網站規則。
免責聲明
這些資訊和出版物並不意味著也不構成TradingView提供或認可的金融、投資、交易或其他類型的意見或建議。請在使用條款閱讀更多資訊。