OPEN-SOURCE SCRIPT
Linear Regression Log Channel with 3 Standard Deviations, Alerts
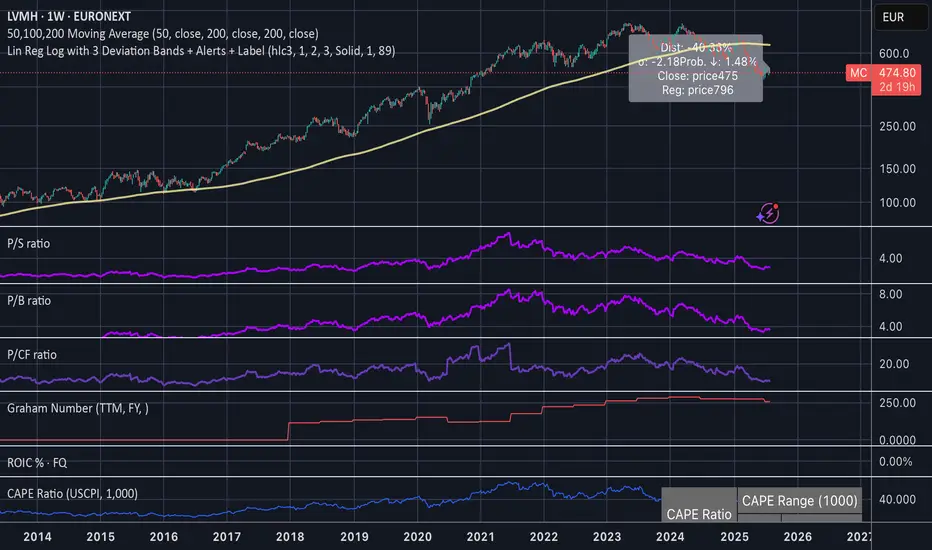
This indicator plots a logarithmic linear regression trendline starting from a user-defined date, along with ±1, ±2, and ±3 standard deviation bands. It is designed to help you visualize long-term price trends and statistically significant deviations.
Features:
• Log-scale linear regression line based on price since the selected start date
• Upper and lower bands at 1σ, 2σ, and 3σ, with the 3σ bands dashed for emphasis
• Optional filled channels between deviation bands
• Dynamic label showing:
• Distance from regression (in %)
• Distance in standard deviations (σ)
• Current price and regression value
• Estimated probability (assuming normal distribution) that the price continues moving further in its current direction
• Built-in alerts when price crosses the regression line or any of the deviation bands
This tool is useful for:
• Identifying mean-reversion setups or stretched trends
• Estimating likelihood of further directional movement
• Spotting statistically rare price conditions (e.g., >2σ or >3σ)
開源腳本
秉持TradingView一貫精神,這個腳本的創作者將其設為開源,以便交易者檢視並驗證其功能。向作者致敬!您可以免費使用此腳本,但請注意,重新發佈代碼需遵守我們的社群規範。
免責聲明
這些資訊和出版物並非旨在提供,也不構成TradingView提供或認可的任何形式的財務、投資、交易或其他類型的建議或推薦。請閱讀使用條款以了解更多資訊。
開源腳本
秉持TradingView一貫精神,這個腳本的創作者將其設為開源,以便交易者檢視並驗證其功能。向作者致敬!您可以免費使用此腳本,但請注意,重新發佈代碼需遵守我們的社群規範。
免責聲明
這些資訊和出版物並非旨在提供,也不構成TradingView提供或認可的任何形式的財務、投資、交易或其他類型的建議或推薦。請閱讀使用條款以了解更多資訊。