OPEN-SOURCE SCRIPT
MACD-V with RSI Gradient
## Overview
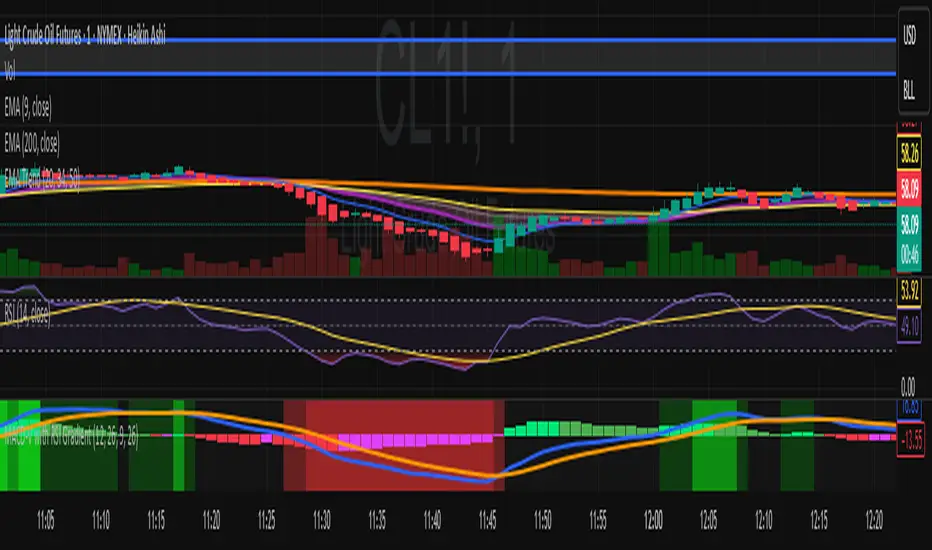
MACD-V is a volatility-adjusted momentum indicator that normalizes MACD using ATR. This version adds a dynamic RSI-based background gradient to highlight momentum zones visually.
## Features
- **MACD-V Line**: EMA-based momentum normalized by ATR
- **Signal Line**: EMA of MACD-V
- **Histogram**: Color-coded based on slope and polarity
- **RSI Gradient Background**: Shading from bright green (RSI > 75) to bright red (RSI < 30), with intermediate tones for momentum context
## Use Case
Designed for 30-minute oil futures charts, this indicator helps identify:
- Trend strength and reversals
- Momentum zones using RSI shading
- Pullback opportunities and exhaustion zones
## Inputs
- Fast EMA (default: 12)
- Slow EMA (default: 26)
- Signal EMA (default: 9)
- ATR Length (default: 26)
## Notes
- RSI shading is purely visual—no alerts are wired in yet
- Histogram renders behind MACD-V and Signal lines for clarity
- Colors are tuned for dark charts
## Credits
Developed by Mark (SylvaRocks), optimized for tactical clarity and scalping precision.
開源腳本
秉持TradingView一貫精神,這個腳本的創作者將其設為開源,以便交易者檢視並驗證其功能。向作者致敬!您可以免費使用此腳本,但請注意,重新發佈代碼需遵守我們的社群規範。
免責聲明
這些資訊和出版物並非旨在提供,也不構成TradingView提供或認可的任何形式的財務、投資、交易或其他類型的建議或推薦。請閱讀使用條款以了解更多資訊。
開源腳本
秉持TradingView一貫精神,這個腳本的創作者將其設為開源,以便交易者檢視並驗證其功能。向作者致敬!您可以免費使用此腳本,但請注意,重新發佈代碼需遵守我們的社群規範。
免責聲明
這些資訊和出版物並非旨在提供,也不構成TradingView提供或認可的任何形式的財務、投資、交易或其他類型的建議或推薦。請閱讀使用條款以了解更多資訊。