OPEN-SOURCE SCRIPT
已更新 [SGM VaR Stats VS Empirical]
Main Functions
Logarithmic Returns & Historical Data
Calculates logarithmic returns from closing prices.
Stores these returns in a dynamic array with a configurable maximum size.
Approximation of the Inverse Error Function
Uses an approximation of the erfinv function to calculate z-scores for given confidence levels.
Basic Statistics
Mean: Calculates the average of the data in the array.
Standard Deviation: Measures the dispersion of returns.
Median: Provides a more robust measure of central tendency for skewed distributions.
Z-Score: Converts a confidence level into a standard deviation multiplier.
Empirical vs. Statistical Projection
Empirical Projection
Based on the median of cumulative returns for each projected period.
Applies an adjustable confidence filter to exclude extreme values.
Statistical Projection
Relies on the mean and standard deviation of historical returns.
Incorporates a standard deviation multiplier for confidence-adjusted projections.
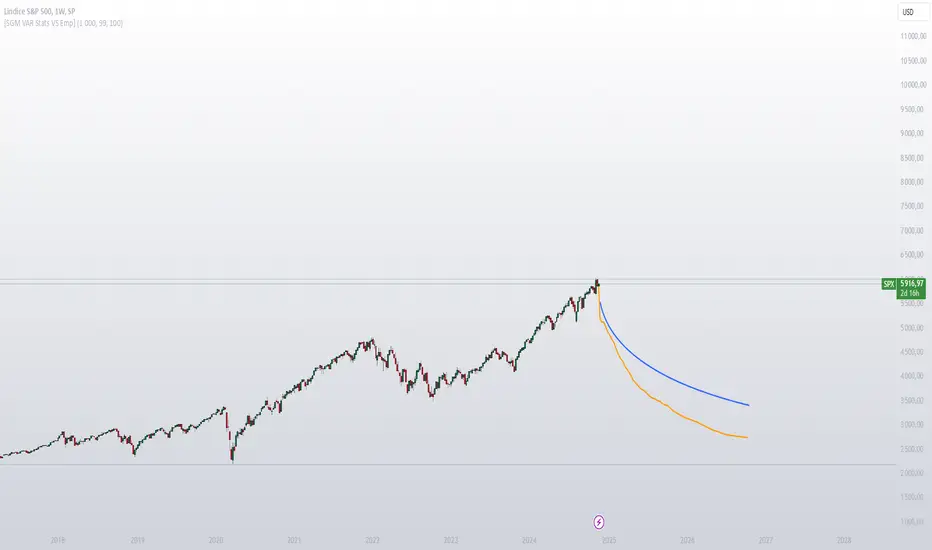
PolyLines (Graphs)
Generates projections visually through polylines:
Statistical Polyline (Blue): Based on traditional statistical methods.
Empirical Polyline (Orange): Derived from empirical data analysis.
Projection Customization
Maximum Data Size: Configurable limit for the historical data array (max_array_size).
Confidence Level: Adjustable by the user (conf_lvl), affects the width of the confidence bands.
Projection Length: Configurable number of projected periods (length_projection).
Key Steps
Capture logarithmic returns and update the historical data array.
Calculate basic statistics (mean, median, standard deviation).
Perform projections:
Empirical: Based on the median of cumulative returns.
Statistical: Based on the mean and standard deviation.
Visualization:
Compare statistical and empirical projections using polylines.
Utility
This script allows users to compare:
Traditional Statistical Projections: Based on mathematical properties of historical returns.
Empirical Projections: Relying on direct historical observations.
Divergence or convergence of these lines also highlights the presence of skewness or kurtosis in the return distribution.

Ideal for traders and financial analysts looking to assess an asset’s potential future performance using combined statistical and empirical approaches.
Logarithmic Returns & Historical Data
Calculates logarithmic returns from closing prices.
Stores these returns in a dynamic array with a configurable maximum size.
Approximation of the Inverse Error Function
Uses an approximation of the erfinv function to calculate z-scores for given confidence levels.
Basic Statistics
Mean: Calculates the average of the data in the array.
Standard Deviation: Measures the dispersion of returns.
Median: Provides a more robust measure of central tendency for skewed distributions.
Z-Score: Converts a confidence level into a standard deviation multiplier.
Empirical vs. Statistical Projection
Empirical Projection
Based on the median of cumulative returns for each projected period.
Applies an adjustable confidence filter to exclude extreme values.
Statistical Projection
Relies on the mean and standard deviation of historical returns.
Incorporates a standard deviation multiplier for confidence-adjusted projections.
PolyLines (Graphs)
Generates projections visually through polylines:
Statistical Polyline (Blue): Based on traditional statistical methods.
Empirical Polyline (Orange): Derived from empirical data analysis.
Projection Customization
Maximum Data Size: Configurable limit for the historical data array (max_array_size).
Confidence Level: Adjustable by the user (conf_lvl), affects the width of the confidence bands.
Projection Length: Configurable number of projected periods (length_projection).
Key Steps
Capture logarithmic returns and update the historical data array.
Calculate basic statistics (mean, median, standard deviation).
Perform projections:
Empirical: Based on the median of cumulative returns.
Statistical: Based on the mean and standard deviation.
Visualization:
Compare statistical and empirical projections using polylines.
Utility
This script allows users to compare:
Traditional Statistical Projections: Based on mathematical properties of historical returns.
Empirical Projections: Relying on direct historical observations.
Divergence or convergence of these lines also highlights the presence of skewness or kurtosis in the return distribution.
Ideal for traders and financial analysts looking to assess an asset’s potential future performance using combined statistical and empirical approaches.
發行說明
changing initial settings發行說明
-開源腳本
秉持TradingView一貫精神,這個腳本的創作者將其設為開源,以便交易者檢視並驗證其功能。向作者致敬!您可以免費使用此腳本,但請注意,重新發佈代碼需遵守我們的社群規範。
Sigaud | Junior Quantitative Trader & Developer
Combining technical expertise with analytical precision.
Gaining experience and growing in the field.
📧 Contact: from the website
Combining technical expertise with analytical precision.
Gaining experience and growing in the field.
📧 Contact: from the website
免責聲明
這些資訊和出版物並非旨在提供,也不構成TradingView提供或認可的任何形式的財務、投資、交易或其他類型的建議或推薦。請閱讀使用條款以了解更多資訊。
開源腳本
秉持TradingView一貫精神,這個腳本的創作者將其設為開源,以便交易者檢視並驗證其功能。向作者致敬!您可以免費使用此腳本,但請注意,重新發佈代碼需遵守我們的社群規範。
Sigaud | Junior Quantitative Trader & Developer
Combining technical expertise with analytical precision.
Gaining experience and growing in the field.
📧 Contact: from the website
Combining technical expertise with analytical precision.
Gaining experience and growing in the field.
📧 Contact: from the website
免責聲明
這些資訊和出版物並非旨在提供,也不構成TradingView提供或認可的任何形式的財務、投資、交易或其他類型的建議或推薦。請閱讀使用條款以了解更多資訊。