INVITE-ONLY SCRIPT
已更新 TM_DAY_TRACKER
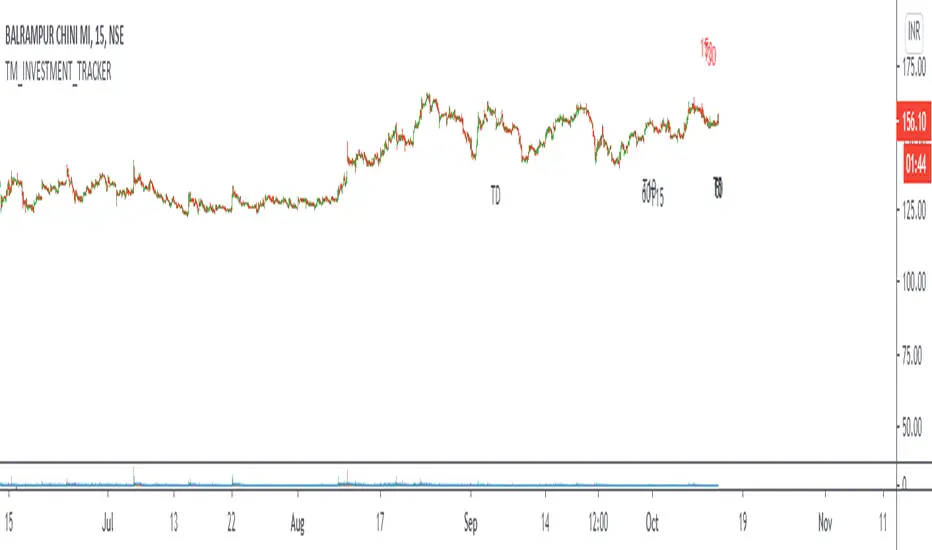
Day Tracker Indicator shows overall trend or market direction for Intraday / Swing Position along with Buy or sell signal.
Terminology Use ==> B- Buy, S- Sale Signal, and Numbers are to show timeframe indication there is presence of buyer or seller like B1 for buy signal on 1 minute timeframe etc.
Display and Interpretation ==> There are 3 lines in trend chart, line-1 light thin, line-2 dark less thick and line-3 bold thick. These lines having Green or Red color according to market signal and trend change where green for positive trend, red for negative trend
line-1 represents market strength and order build up; line-2 represents volatility or momentum ; line-3 represents market trend or direction
Timeframe ==> Use proper Signal with swing trend on 1 minute, 3 minute 5 minute, 15 minute time frame
What to Identify ==> Overall Trend for the intraday and swing Period
How to Use ==>
line-1 light thin "Green/Red" work as primary support / resistance and area of value. During the price movement price takes support or resistance here and bounce back or reverse back"
line-2 dark less thick "Green/Red" work as volatility line. This is area of volatility and direction to main trend. Price crossing above or below will give huge direction movement
line-3 bold thick "Green/Red" work as trend line or market direction line. This is area where strong or weak price will decide its direction
Note: - Use market structure, chart pattern, trend lines and price action parameter for more confirmation.
Entry ==>
Let’s wait the proper area of support or resistance ( Area of Value in case of trend pattern use)
Exit ==>
SL of swing high/low out of market structure with proper risk management and target with proper Risk/ Reward Ratio
發行說明
Updates僅限邀請腳本
僅作者批准的使用者才能訪問此腳本。您需要申請並獲得使用許可,通常需在付款後才能取得。更多詳情,請依照作者以下的指示操作,或直接聯絡TradingMind24。
TradingView不建議在未完全信任作者並了解其運作方式的情況下購買或使用腳本。您也可以在我們的社群腳本中找到免費的開源替代方案。
作者的說明
免責聲明
這些資訊和出版物並非旨在提供,也不構成TradingView提供或認可的任何形式的財務、投資、交易或其他類型的建議或推薦。請閱讀使用條款以了解更多資訊。
僅限邀請腳本
僅作者批准的使用者才能訪問此腳本。您需要申請並獲得使用許可,通常需在付款後才能取得。更多詳情,請依照作者以下的指示操作,或直接聯絡TradingMind24。
TradingView不建議在未完全信任作者並了解其運作方式的情況下購買或使用腳本。您也可以在我們的社群腳本中找到免費的開源替代方案。
作者的說明
免責聲明
這些資訊和出版物並非旨在提供,也不構成TradingView提供或認可的任何形式的財務、投資、交易或其他類型的建議或推薦。請閱讀使用條款以了解更多資訊。