OPEN-SOURCE SCRIPT
已更新 Significance Condensed
// Indicator Name: "Significance Condensed"
// This is a "Multi-Indicator", which includes:
// Custom Candlesticks with Bearish/Bullish Engulfing Body Fills, otherwise hollow.
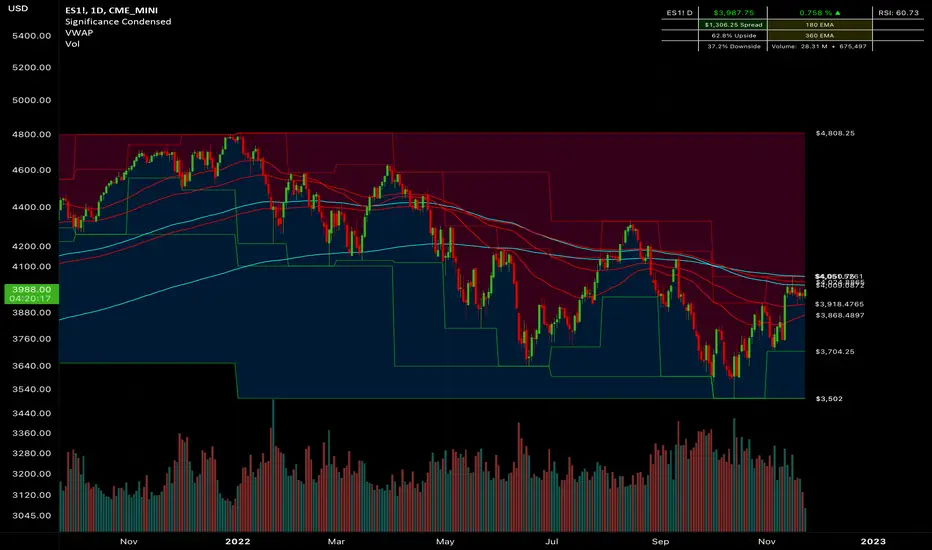
// 3 EMA's with user inputs + 2 Static EMA's
// Continuous plots of high/low values with up to 3 overlapping timeframes.
// Table: Contains the TICKER.ID, Current Price, Percent On Day (note that it does not work for extended hours charts well), Current Timeframe RSI Value(Adjustable), Spread(Difference from the Current Price to High value, 2 Static EMA displays, Upside/Downside(Percentile from Current Price to High/Low Range, respectively, and Volume(Daily Volume + Current Bar Volume)
//CANDLESTICK DISCLAIMER
// If you would like to use the custom candlestick plots, (hollow, else engulfing), that come along with this indicator,
// be sure to disable the Candlestick Body, Wick, and Border under Chart Appearance; and then enable "Candlesticks Active" in the indicator settings.
//Final Product. Finito. Done.
// This is a "Multi-Indicator", which includes:
// Custom Candlesticks with Bearish/Bullish Engulfing Body Fills, otherwise hollow.
// 3 EMA's with user inputs + 2 Static EMA's
// Continuous plots of high/low values with up to 3 overlapping timeframes.
// Table: Contains the TICKER.ID, Current Price, Percent On Day (note that it does not work for extended hours charts well), Current Timeframe RSI Value(Adjustable), Spread(Difference from the Current Price to High value, 2 Static EMA displays, Upside/Downside(Percentile from Current Price to High/Low Range, respectively, and Volume(Daily Volume + Current Bar Volume)
//CANDLESTICK DISCLAIMER
// If you would like to use the custom candlestick plots, (hollow, else engulfing), that come along with this indicator,
// be sure to disable the Candlestick Body, Wick, and Border under Chart Appearance; and then enable "Candlesticks Active" in the indicator settings.
//Final Product. Finito. Done.
發行說明
Added a tooltip to the Timeframe that is coordinated to the Spread Math on the table.Corrected a mis-titled User Ema
Corrected Timeframe Logic Flow for Ease of Understanding.
Changed some Default Colors.
Mr. Storm
Enjoy!
開源腳本
本著TradingView的真正精神,此腳本的創建者將其開源,以便交易者可以查看和驗證其功能。向作者致敬!雖然您可以免費使用它,但請記住,重新發佈程式碼必須遵守我們的網站規則。
免責聲明
這些資訊和出版物並不意味著也不構成TradingView提供或認可的金融、投資、交易或其他類型的意見或建議。請在使用條款閱讀更多資訊。
免責聲明
這些資訊和出版物並不意味著也不構成TradingView提供或認可的金融、投資、交易或其他類型的意見或建議。請在使用條款閱讀更多資訊。