OPEN-SOURCE SCRIPT
TKP RSI BAR COLOR
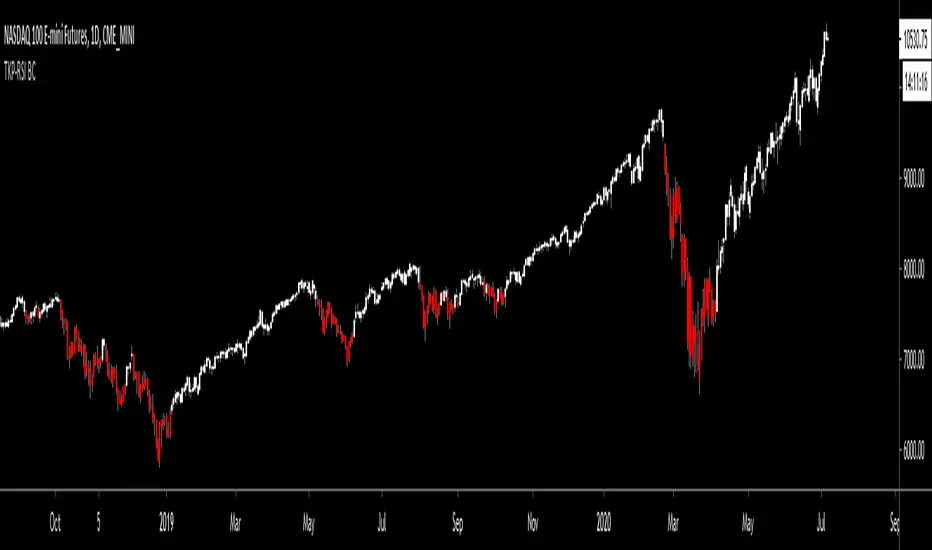
This script was influenced by Scilentor's- "RSI Bar Colors / Scilentor". I improved upon the Idea by adding the ability to change the full range of RSI (Between 0 through 100) to any color you want within 5 point increments.
Traditional use of RSI is to use it as an "Overbought" and "Oversold" indicator. A more uncommon/unknown use, especially among new traders, is to use is as a "Momentum" indicator. I personally like to look for stocks where RSI>50
Default settings are set to color all bars red when below 50, and white when above 50, but try for your self setting different colors above 70, and below 30 to better see overbought and oversold conditions. I got a lot of requests for this script and I hope it helps you in your trading journey :-)
開源腳本
秉持TradingView一貫精神,這個腳本的創作者將其設為開源,以便交易者檢視並驗證其功能。向作者致敬!您可以免費使用此腳本,但請注意,重新發佈代碼需遵守我們的社群規範。
免責聲明
這些資訊和出版物並非旨在提供,也不構成TradingView提供或認可的任何形式的財務、投資、交易或其他類型的建議或推薦。請閱讀使用條款以了解更多資訊。
開源腳本
秉持TradingView一貫精神,這個腳本的創作者將其設為開源,以便交易者檢視並驗證其功能。向作者致敬!您可以免費使用此腳本,但請注意,重新發佈代碼需遵守我們的社群規範。
免責聲明
這些資訊和出版物並非旨在提供,也不構成TradingView提供或認可的任何形式的財務、投資、交易或其他類型的建議或推薦。請閱讀使用條款以了解更多資訊。