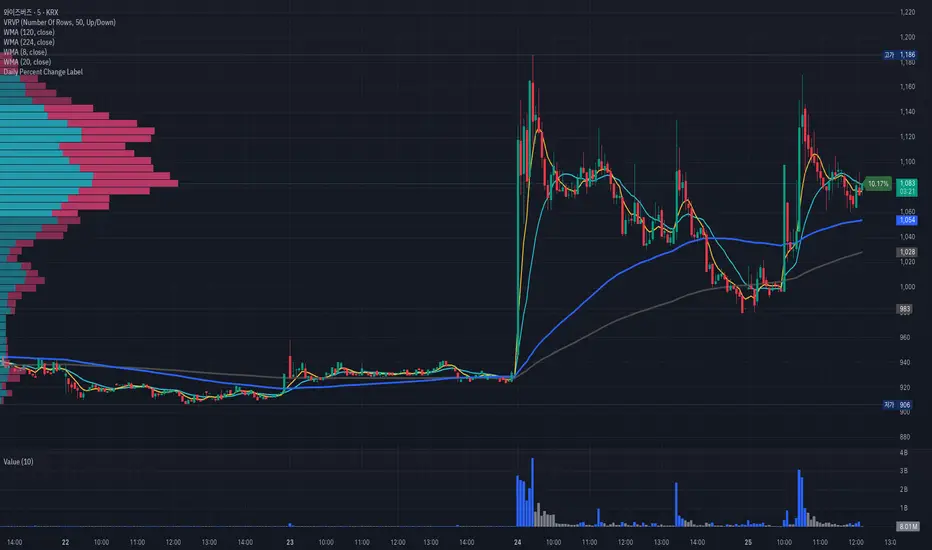
Daily Percent Change LabelDaily Percent Change Label
Overview
This Pine Script displays the percentage change from the previous day's closing price as a text label near the current price level on the chart. It works seamlessly across any timeframe (daily, hourly, minute charts) by referencing the daily chart's previous close, making it perfect for traders tracking daily performance.
The label is displayed with a semi-transparent background (green for positive changes, red for negative changes) and white text, ensuring a clean and readable appearance.
Features
Accurate Daily Percent Change: Calculates the percentage change based on the previous day's closing price, even on intraday timeframes (e.g., 1-hour, 5-minute).
Dynamic Label: Shows the percentage change as a label aligned with the current price, updating in real-time.
Color-Coded Background: Semi-transparent green background for positive changes and red for negative changes.
Customizable: Adjust label position, size, color, and style to fit your preferences.
Minimal Impact: No additional plots or graphs, keeping the chart uncluttered.
How to Use
Add the Script:
Copy and paste the script into the Pine Editor in TradingView.
Click "Add to Chart" to apply it.
Check the Output:
A text label (e.g., "+2.34%" or "-1.56%") appears near the current price with a semi-transparent background.
The label is colored green (positive) or red (negative) and updates in real-time.
Switch Timeframes:
Works on any timeframe. The percentage change is always calculated relative to the previous day's close.
Customization Options
Modify the label.new function to customize the label:
Label Position:
Change style=label.style_label_left to label.style_label_right or label.style_label_down to adjust label placement.
Adjust bar_index with an offset (e.g., bar_index + 1) to move the label horizontally.
Text Color:
Modify textcolor=color.white to another color (e.g., color.rgb(255, 255, 0) for yellow).
Background Color:
Adjust color=percent_change >= 0 ? color.new(color.green, 50) : color.new(color.red, 50) to change transparency (e.g., color.new(color.green, 0) for no transparency).
Text Size:
Change size=size.normal to size.small or size.large for smaller or larger text.
Code Details
Timeframe Handling: Uses request.security with the "D" timeframe to fetch the previous day's closing price, ensuring accuracy on intraday charts.
Performance: Updates only on the last bar (barstate.islast) for optimal performance.
Dynamic Styling: Background color changes based on the direction of the price change.
Notes
The label is positioned near the current price for easy reference. To move it closer to the Y-axis, adjust the bar_index offset.
For different reference points (e.g., weekly close), modify the request.security timeframe (e.g., "W" for weekly).
Ensure the script is copied correctly without extra spaces or characters. Use a plain text editor (e.g., Notepad) for copying.
Feedback
Please share your feedback or customizations in the comments! If you find this script helpful, give it a thumbs-up or let others know how you're using it. Happy trading!
Change
Custom Performance TableThis script generates a table designed to provide a concise yet highly customizable overview of the performance of multiple financial instruments, displayed directly on the chart. The table can include up to 40 tickers, each individually configurable, with values updated in real time based on either the current chart timeframe or a specific user-selected timeframe.
NOTE : The update frequency of the table values depends on the refresh rate of the chart's main ticker to which the indicator is applied. To ensure a consistent and reliable data feed, especially when monitoring heterogeneous instruments, it is recommended to apply the indicator to a highly liquid and continuously traded asset, such as BTCUSD.
PERFORMANCE CALCULATION MODES
You can choose from three different performance calculation modes:
1) Change % (Percentage Change)
Displays the percentage change of the current price compared to the previous candle within the selected timeframe.
(Current Price - Previous Price) / Previous Price * 100
This mode provides an immediate and straightforward measure of each instrument's percentage movement, useful for quick visual comparisons of relative strength among assets.
2) Z-Score
The Z-Score measures how much the current price variation deviates from the historical average variation, relative to the standard deviation of those variations.
(Current Variation - Average Variation) / Standard Deviation of Variations
The result indicates how statistically unusual a movement is:
- Values near 0 suggest normal variations.
- Values above ±2 indicate statistically significant deviations.
This is a valuable tool for identifying overbought/oversold conditions or market stress events and is often used in mean reversion strategies.
NOTE : Due to technical constraints, Z-Score can only be calculated when the selected timeframe matches the chart's timeframe exactly.
3) RAROC (Risk-Adjusted Return on Capital)
RAROC expresses an asset's performance in relation to the risk taken, measured through its volatility (standard deviation of price).
Percentage Change / Standard Deviation of Price
It allows for an assessment of return efficiency in relation to volatility.
A high RAROC value indicates a high return relative to the risk, making it a useful tool for comparing assets with different risk profiles. It is especially suitable for portfolio selection and allocation purposes.
TABLE CONFIGURATION
Each ticker can be customized with its own label, colors, and position in the table.
Each row can display the ticker name or a custom label, which, at the user's discretion, can either replace the name or be shown as an informational tooltip.
The table can be placed anywhere on the chart using horizontal and vertical offset parameters. Thanks to offset support, you can, for example, create financial market overview layouts. This can be done by completely “cleaning” the chart from price and indicators using TradingView settings, and then displaying multiple tables simultaneously (see the example chart published here).
Advanced customization options are also available for the table's appearance, including font settings, colors, borders, and more.
CALCULATION TIMEFRAME
The indicator allows the user to force a specific timeframe (Daily, Weekly, Monthly, Yearly) when applied to intraday charts.
However, for Z-Score mode, the selected timeframe must match the chart's timeframe exactly to ensure correct computation. Otherwise, the script will halt until settings are properly adjusted.
USAGE NOTES
Custom Performance Table is a flexible and adaptable tool, suitable for both intraday operations and medium- to long-term analysis. It is designed for traders and analysts who need to compare assets based on quantitative metrics, whether simple (like percentage change) or more advanced and risk-adjusted (such as Z-Score and RAROC).

Half Causal EstimatorOverview
The Half Causal Estimator is a specialized filtering method that provides responsive averages of market variables (volume, true range, or price change) with significantly reduced time delay compared to traditional moving averages. It employs a hybrid approach that leverages both historical data and time-of-day patterns to create a timely representation of market activity while maintaining smooth output.
Core Concept
Traditional moving averages suffer from time lag, which can delay signals and reduce their effectiveness for real-time decision making. The Half Causal Estimator addresses this limitation by using a non-causal filtering method that incorporates recent historical data (the causal component) alongside expected future behavior based on time-of-day patterns (the non-causal component).
This dual approach allows the filter to respond more quickly to changing market conditions while maintaining smoothness. The name "Half Causal" refers to this hybrid methodology—half of the data window comes from actual historical observations, while the other half is derived from time-of-day patterns observed over multiple days. By incorporating these "future" values from past patterns, the estimator can reduce the inherent lag present in traditional moving averages.
How It Works
The indicator operates through several coordinated steps. First, it stores and organizes market data by specific times of day (minutes/hours). Then it builds a profile of typical behavior for each time period. For calculations, it creates a filtering window where half consists of recent actual data and half consists of expected future values based on historical time-of-day patterns. Finally, it applies a kernel-based smoothing function to weight the values in this composite window.
This approach is particularly effective because market variables like volume, true range, and price changes tend to follow recognizable intraday patterns (they are positive values without DC components). By leveraging these patterns, the indicator doesn't try to predict future values in the traditional sense, but rather incorporates the average historical behavior at those future times into the current estimate.
The benefit of using this "average future data" approach is that it counteracts the lag inherent in traditional moving averages. In a standard moving average, recent price action is underweighted because older data points hold equal influence. By incorporating time-of-day averages for future periods, the Half Causal Estimator essentially shifts the center of the filter window closer to the current bar, resulting in more timely outputs while maintaining smoothing benefits.
Understanding Kernel Smoothing
At the heart of the Half Causal Estimator is kernel smoothing, a statistical technique that creates weighted averages where points closer to the center receive higher weights. This approach offers several advantages over simple moving averages. Unlike simple moving averages that weight all points equally, kernel smoothing applies a mathematically defined weight distribution. The weighting function helps minimize the impact of outliers and random fluctuations. Additionally, by adjusting the kernel width parameter, users can fine-tune the balance between responsiveness and smoothness.
The indicator supports three kernel types. The Gaussian kernel uses a bell-shaped distribution that weights central points heavily while still considering distant points. The Epanechnikov kernel employs a parabolic function that provides efficient noise reduction with a finite support range. The Triangular kernel applies a linear weighting that decreases uniformly from center to edges. These kernel functions provide the mathematical foundation for how the filter processes the combined window of past and "future" data points.
Applicable Data Sources
The indicator can be applied to three different data sources: volume (the trading volume of the security), true range (expressed as a percentage, measuring volatility), and change (the absolute percentage change from one closing price to the next).
Each of these variables shares the characteristic of being consistently positive and exhibiting cyclical intraday patterns, making them ideal candidates for this filtering approach.
Practical Applications
The Half Causal Estimator excels in scenarios where timely information is crucial. It helps in identifying volume climaxes or diminishing volume trends earlier than conventional indicators. It can detect changes in volatility patterns with reduced lag. The indicator is also useful for recognizing shifts in price momentum before they become obvious in price action, and providing smoother data for algorithmic trading systems that require reduced noise without sacrificing timeliness.
When volatility or volume spikes occur, conventional moving averages typically lag behind, potentially causing missed opportunities or delayed responses. The Half Causal Estimator produces signals that align more closely with actual market turns.
Technical Implementation
The implementation of the Half Causal Estimator involves several technical components working together. Data collection and organization is the first step—the indicator maintains a data structure that organizes market data by specific times of day. This creates a historical record of how volume, true range, or price change typically behaves at each minute/hour of the trading day.
For each calculation, the indicator constructs a composite window consisting of recent actual data points from the current session (the causal half) and historical averages for upcoming time periods from previous sessions (the non-causal half). The selected kernel function is then applied to this composite window, creating a weighted average where points closer to the center receive higher weights according to the mathematical properties of the chosen kernel. Finally, the kernel weights are normalized to ensure the output maintains proper scaling regardless of the kernel type or width parameter.
This framework enables the indicator to leverage the predictable time-of-day components in market data without trying to predict specific future values. Instead, it uses average historical patterns to reduce lag while maintaining the statistical benefits of smoothing techniques.
Configuration Options
The indicator provides several customization options. The data period setting determines the number of days of observations to store (0 uses all available data). Filter length controls the number of historical data points for the filter (total window size is length × 2 - 1). Filter width adjusts the width of the kernel function. Users can also select between Gaussian, Epanechnikov, and Triangular kernel functions, and customize visual settings such as colors and line width.
These parameters allow for fine-tuning the balance between responsiveness and smoothness based on individual trading preferences and the specific characteristics of the traded instrument.
Limitations
The indicator requires minute-based intraday timeframes, securities with volume data (when using volume as the source), and sufficient historical data to establish time-of-day patterns.
Conclusion
The Half Causal Estimator represents an innovative approach to technical analysis that addresses one of the fundamental limitations of traditional indicators: time lag. By incorporating time-of-day patterns into its calculations, it provides a more timely representation of market variables while maintaining the noise-reduction benefits of smoothing. This makes it a valuable tool for traders who need to make decisions based on real-time information about volume, volatility, or price changes.

Percent Change HistogramThis indicator shows you percent changes in a super visual way using a color-coded histogram.
Here's how the colors work:
🟩 Dark green = percent change is growing stronger
🟢 Light green = still positive but losing steam
🟥 Dark red = getting more negative
🔴 Light red = negative but improving
The cool part? You can set any lookback period you want. For example:
24 periods on 1H chart = last 24 hours
30 periods on daily = last month
7 periods on daily = last week
Pro tip: You're not locked to your chart's timeframe! Want to see monthly changes while trading on 5min?
No problem.
You can even stack multiple indicators to watch different intervals simultaneously (daily, weekly, monthly) - super helpful for multi-timeframe analysis.
Perfect for spotting momentum shifts across different timeframes without switching between charts.

Weekly Stacked Daily Changes [LuxAlgo]The Weekly Stacked Daily Changes tool allows traders to compare daily net price changes for each day of the week, stacked by week. It provides a very convenient way to compare daily and weekly volatility at the same time.
🔶 USAGE
The tool requires no configuration and works perfectly out of the box, displaying the net price change for each day of the week as stacked boxes of the appropriate size.
Traders can adjust the width of the columns and the spacing between days and weeks, options to change the color and disable the months and new month lines are also available.
🔹 Bottom Stack Bias
This feature allows traders to compare weekly volatility in two different ways.
With this feature disabled, all weeks use zero as the bottom of the stack, so traders can see at a glance weeks with more volatility and weeks with less volatility.
Enabling this feature will cause the tool to display the stacks with the weekly net price change as the bottom, so if a stack starts below the zero line it means that week has a negative net return, and if it starts above the zero line it means that week has a positive net return.
🔶 SETTINGS
Width: Select the fixed width for each column.
Offset: Choose the fixed width between each column.
Spacing: Select the distance between each day within each column.
🔹 Style
Bottom Stack Bias: Use weekly net price change as the bottom of the stack.
Bullish Change: Color for days with positive net price change
Bearish Change: Color for days with negative net price change
Show Months: Under each week stack, display the month
Show Months Delimiter: Display a line indicating the start of a new month

Percent % Change Since Specific Date / TimeFUNCTIONS
- User specified Date/Time of importance
- Calculate the percent change since user input date/time to current price
- Plot a line at user input date/time
USAGE
You want to see how much price has changed since a certain important date/time.
Example important date: Trump win, FED rate change, Earnings, etc.

Average Bullish & Bearish Percentage ChangeAverage Bullish & Bearish Percentage Change
Processes two key aspects of directional market movements relative to price levels. Unlike traditional momentum tools, it separately calculates the average of positive and negative percentage changes in price using user-defined independent counts of actual past bullish and bearish candles. This approach delivers comprehensive and precise view of average percentage changes.
FEATURES:
Count-Based Averages: Separate averaging of bullish and bearish %𝜟 based on their respective number of occurrences ensures reliable and precise momentum calculations.
Customizable Averaging: User-defined number of candle count sets number of past bullish and bearish candles used in independent averaging.
Two Methods of Candle Metrics:
1. Net Move: Focuses on the body range of the candle, emphasizing the net directional movement.
2. Full Capacity: Incorporates wicks and gaps to capture full potential of the bar.
The indicator classifies Doji candles contextually, ensuring they are appropriately factored into the bullish or bearish metrics to avoid mistakes in calculation:
1. Standard Doji - open equals close.
2. Flat Close Doji - Candles where the close matches the previous close.
Timeframe Flexibility:
The indicator can be applied across any desired timeframe, allowing for seamless multi-timeframe analysis.
HOW TO USE
Select Method of Bar Metrics:
Net Move: For analyzing markets where price changes are consistent and bars are close to each other.
Full Capacity: Incorporates wicks and gaps, providing relevant figures for markets like stocks
Set the number of past candles to average:
🟩 Average Past Bullish Candles (Default: 10)
🟥 Average Past Bullish Candles (Default: 10)
Why Percentage Change Is Important
Standardized Measurement Across Assets:
Percentage change normalizes price movements, making it easier to compare different assets with varying price levels. For example, a $1 move in a $10 stock is significant, but the same $1 move in a $1,000 stock is negligible.
Highlights Relative Impact:
By measuring the price change as a percentage of the close, traders can better understand the relative impact of a move on the asset’s overall value.
Volatility Insights:
A high percentage change indicates heightened volatility, which can be a signal of potential opportunities or risks, making it more actionable than raw price changes. Percents directly reflect the strength of buying or selling pressure, providing a clearer view of momentum compared to raw price moves, which may not account for the relative size of the move.
By focusing on percentage change, this indicator provides a normalized, actionable, and insightful measure of market momentum, which is critical for comparing, analyzing, and acting on price movements across various assets and conditions.

Relative Range at Time/ Relative volatility / High−Low This script is designed to help you compare the size of the current price candle (the difference between the highest and lowest prices in a given time period) to the average size of the last several candles. It does this by calculating the average range of a certain number of previous candles (you can set how many with the "Length" input) and then dividing the current candle's range by this average. The result is plotted on the chart as a bar: if the current candle's range is larger than the average, the bar is green; if it's smaller, the bar is red. A horizontal line is also drawn at the value of 1, so you can easily see whether the current candle's range is above or below the average. If there’s an issue with the data, the script will show an error message to let you know.

Learning Understanding ta.change//First script I have published. Constructive criticism is welcome.
// I hope this may be helpful to you.
// Initially, I did this for myself as I was getting some odd results from the ta.change function. Turns out it was my error LOL. What a surprise!
// Typical syntax: ta.change(source, value)
// value doesn't need to be included. If it isn't, it will only calculate the change between the last and current value.
// Conclusion. ta.change simply calculates the difference between a previous value/candle and the latest value/candle current value in that series. Positive number states that the recent is higher.
// Bonus :-) Function on line 34 outputs the changes in a positive figure (so as to be able to sum the changes/volatility of the series of values)

Stock Data Table█ OVERVIEW
This is a table that shows some information about stocks. It is divided into four sections:
1) Correlation
2) Shares
3) Daily Data
4) Extended Session Data
The table is completely modular, which means you can add or remove each element from the settings menu, and it will automatically rearrange its spaces.
It is also highly customizable, to the extent that you can change almost any color, remove or change titles, invert section rows, and much more.
1) Correlation
The script checks if the stock is listed on NASDAQ, and if so, uses the QQQ (Nasdaq-100 ETF) as the reference index in the first cell; otherwise, it uses the SPY (S&P 500 ETF). The length of the correlation is shown in the second cell. The table then displays the correlation between the reference index and the other index, and the correlation between the reference index and the stock.
To make it easier to interpret the correlation values, each row's last cell is color-coded with a gradient to highlight the type of correlation, and the direction of the gradient can be customized.
The correlation coefficient is a statistical measure that quantifies the strength and direction of the relationship between two variables, indicating how changes in one variable are associated with changes in the other variable, so it can be used to identify patterns and trends.
If you are interested in correlation, I suggest taking a look at my dedicated indicator:
2) Shares
This feature provides you with quick access to key information about shares and market capitalization.
On one row, you can view the total shares outstanding and the market capitalization for the fiscal year or the quarterly year. The total shares outstanding represents the total number of shares of the stock that have been issued and are currently outstanding, regardless of whether they are held by insiders or public investors. The market capitalization is a widely used measure of the company's value as determined by the stock market, calculated by multiplying its current stock price with the total number of outstanding shares.
The other row shows the float, which is the number of shares of a company that are available for public trading, and the corresponding free-float market cap, calculated by multiplying the company's current stock price with the float. Because Pine Script does not allow retrieving information about quarterly year float, you can view the float and the free-float market cap of the fiscal year only. The data can be displayed at all times or only when the difference between the total shares outstanding and the float is significant enough to result in a difference between the market cap and free-float market cap.
The classification for market cap and free-float market cap is set in this way:
Mega Cap: $200 billion or more
Large Cap: between $10 billion and $200 billion
Mid Cap: between $2 billion and $10 billion
Small Cap: between $300 million and $2 billion
Micro Cap: less than $300 million
Penny Stocks: less than $5 (customizable)
Comparing the free-float market cap to the market cap can provide insights into the liquidity of a stock. In fact, if the float is relatively small compared to the total shares outstanding, it may be more difficult to find buyers or sellers, which could lead to increased volatility. On the other hand, a larger float indicates that the stock is more liquid and may be easier to trade, potentially resulting in lower volatility. However, market conditions can change quickly and significantly, especially for intraday traders, and the free-float can also change as insiders or other large shareholders buy or sell shares. Therefore, comparing the data of the fiscal year with that of the quarterly year may not provide the most up-to-date and accurate information for making trading decisions. This limitation can be mitigated by combining those data with other indicators and tools, such as technical analysis or news events, to gain a better understand of the stock's performance and potential trading opportunities.
3) Daily Data
This section is available on daily charts only due to the lack of accuracy of real-time daily data on other time frames. Here, you can view the Average Daily Volume (ADV) over a preferred time range (20 days by default), and the Daily Change, which represents the percentage difference between the closing price on two consecutive trading days.
ADV is useful in measuring the stock's volatility, as it provides an indication of how much trading activity there is in it. Generally speaking, stocks with higher trading volume tend to be less volatile than stocks with lower trading volume. High trading volume means there are more buyers and sellers actively trading the stock, which makes it easier for investors to buy and sell shares at fair prices. This increased liquidity can help to stabilize the stock price, reducing the potential for large swings in either direction. On the other hand, stocks with lower trading volume may experience greater volatility, as there are fewer buyers and sellers actively trading the stock. This can result in larger price swings, as it may be more difficult for investors to buy or sell shares at fair prices.
The daily percentage change can provide an indication of the stock's volatility, with larger values indicating greater volatility and risk. It can also be compared to that of a benchmark such an index or other stocks in the same sector, helping to determine whether the stock is outperforming or underperforming relative to them.
4) Extended Session Data
The fourth section is available on intraday charts only. This section provides two pieces of information: the Extended Session Change and the Pre-Market Volume.
The Extended Session Change indicates the percentage difference between the previous day's closing price and the latest price in the extended session. This gives you the extent and the direction of the price gap that occurred during extended trading hours.
The Pre-Market Volume shows the sum of all shares traded during the pre-market session. This can be helpful in understanding how much interest the stock gained before the market opened.
By default, the two rows will be visible at all times. They will stop updating after the end of their respective time range, and resume updating when it starts again. However, you can choose to automatically hide them outside of their time ranges.
Both the extended session and pre-market time ranges can be customized. Please note that if you select time ranges outside of the regular market session (as set by default), you must enable the extended session to view the corresponding rows.
█ GENERAL NOTES
• Total Shares Outstanding, Float, Average Daily Volume and Pre-Market Volume cells use a customizable color system based on two thresholds, to help you quickly identify whether the value is "too low/acceptable/too high" or "too low/not enough high/acceptable".
• If you cannot see certain data, that simply means it is not available.

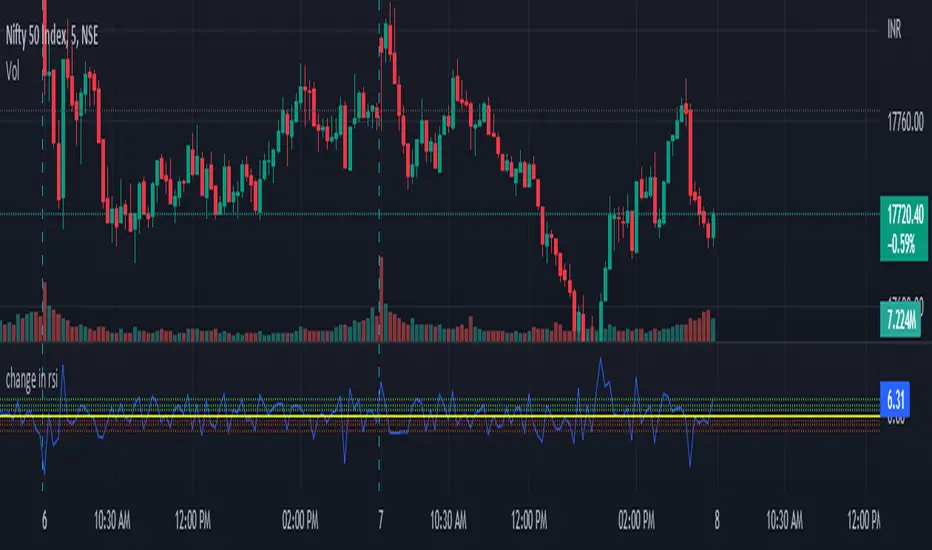
change in rsiThis indicator will show how fast the rsi of a symbol is changing. you can see this as a differentiation function on rsi .
this will show the change in rsi in percentage.
Ex: suppose the rsi of a symbol at present is 60 and the previous value of rsi was 52,
as you can see the rsi has increased, which is a sign of the symbol being bullish .
this indicator will tell by what percentage the rsi of the symbol has increased or decreased.
for the above example, the change in rsi is 15.38% increase.
this is set to default chart time-frame.
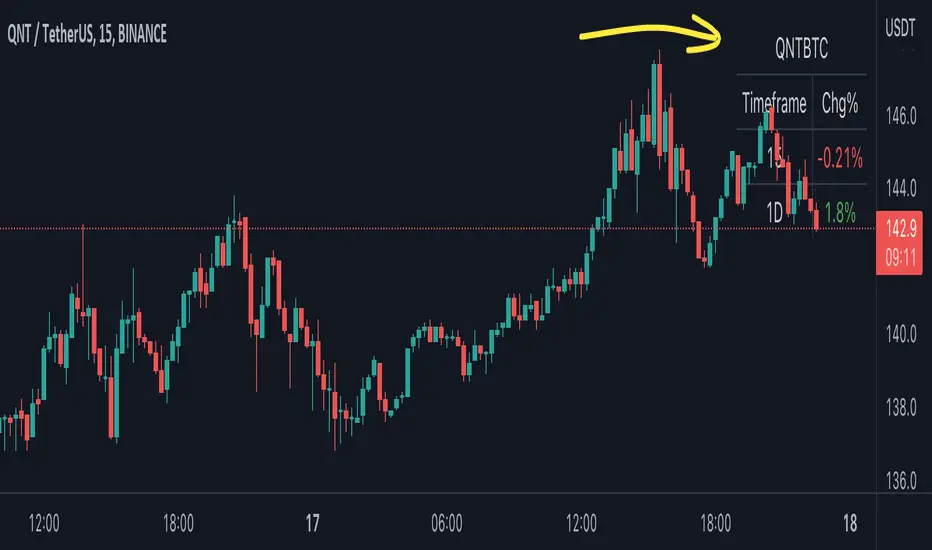
BTC Pair Change %This script makes it easier to quickly check how the BTC pair of the current symbol is performing on any pair.
It adds a " change percentage widge t" (of the BTC pair ) to the top right of the chart.
(Refer to the image for an example.)
The change percentage calculation is performed as described here:
www.tradingview.com
To match the "Chg%" that appears on TradingView watchlists, a 24H (1440min) timeframe is used, as described here:
money.stackexchange.com
In short, this script:
Searches for the BTC pair of the current symbol
Calculates the change % using the above described logic (links)
Adds a " change percentage widget " (of the BTC pair) to the top right of the chart
Allows for using 24H timeframe or the current timeframe (enable " Use current timeframe " under the script options)
Percent ResearchPercent Research is an indicator that will plot a color / column on the chart in case custom requirements are met.
The requirements are:
- Price : Price requirement (equal or above input).
- Change % Up : Amount the price have moved up in percent (equal or above input).
- Change % Down : Amount the price have moved down in percent (equal or below input).
- Change Interval : Amount of bars the above move happened over.
- Volume : Volume requirement (equal or above input).
- Volume Interval : Amount of bars in a row that each require the above volume.
Example: In case one wants to plot whenever price has made a 20 percent move up or down in a week with minimum 100 000 volume for each of the last 2 days one can use.
Change % Up: 20
Change % Down: -20
Change Interval: 5
Volume: 100 000
Volume Interval: 2
The indicator will plot a color on the chart whenever the requirements are met, which then can be used to look into price action for each colored time period.
The values can be customized dependent on preference, example 100% movers over a month or 20% movers over a week etc.

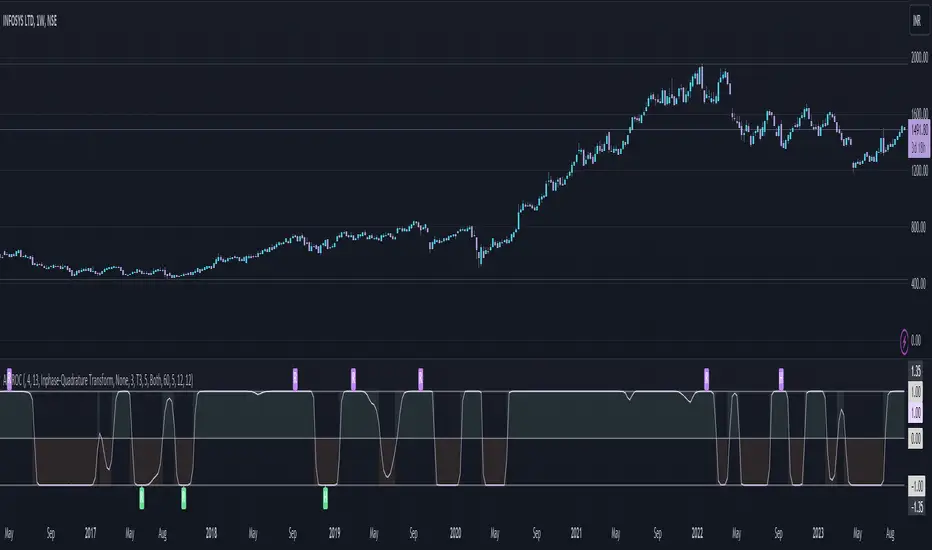
Adaptive Fisherized ROCIntroduction
Hello community, here I applied the Inverse Fisher Transform, Ehlers dominant cycle determination and smoothing methods on a simple Rate of Change (ROC) indicator
You have a lot of options to adjust the indicator.
Usage
The rate of change is most often used to measure the change in a security's price over time.
That's why it is a momentum indicator.
When it is positive, prices are accelerating upward; when negative, downward.
It is useable on every timeframe and could be a potential filter for you your trading system.
IMO it could help you to confirm entries or find exits (e.g. you have a long open, roc goes negative, you exit).
If you use a trend-following strategy, you could maybe look out for red zones in an in uptrend or green zones in a downtrend to confirm your entry on a pullback.
Signals
ROC above 0 => confirms bullish trend
ROC below 0 => confirms bearish trend
ROC hovers near 0 => price is consolidating
Enjoy! 🚀
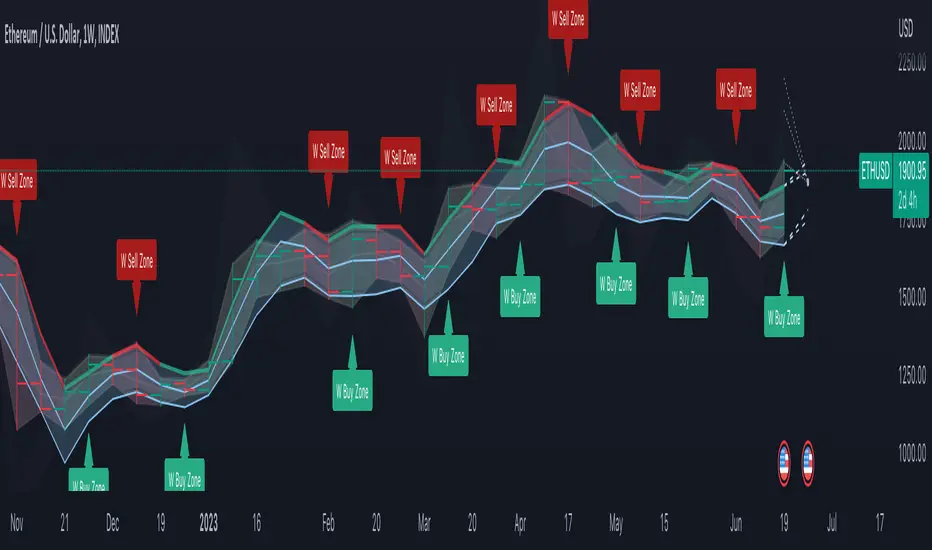
DB Change Forecast ProDB Change Forecast Pro
What does the indicator do?
The DB Change Forecast Pro is a unique indicator that uses price change on HLC3 to detect buy and sell periods along with plotting a linear regression price channel with oversold and undersold zones. It also has a linear regression change forecast mode to optionally project market direction.
Change is calculated by taking a two-bar change of HLC3 and dividing that by the price or, optionally, a fixed divisor.
A fast-moving change cloud is then calculated and displayed as the "regular version" plot (shown in light gray). When the cloud bottom is above low, a buy zone is detected. When the cloud top is below the high, a sell zone is detected.
The linear regression price channel is calculated similarly but using a much slower change rate. The linear regression price channel shows reasonable high, low and HLC3 ranges. At the bar's opening, the channel will be more compact and come fairly accurate about 1/4 into the bar timeframe.
The change forecasted price is projected on the right side of the current bar to indicate the current timeframe direction. Please note this forecasting feature is shown in orange when it's early in the timeframe and gray when the timeframe is more likely to produce an accurate direction forecast for the upcoming bar.
You can use these projected dashed lines to see possible market movements for the Current bar and possible market direction for the next bar. Kindly note these projects change; they should be used to understand possible extreme highs/lows for the current bar or market direction.
The indicator includes an optional change forecast projection feature hidden by default. It will project the market forecast channel with an offset of 1. The forecast is defaulted to an offset of 1 to show market direction. However, you can modify to zero the offset to show the current bar forecast and forecast history.
How should this indicator be used?
First, very important,
1. Settings > Set Symbol to Desired
2. Settings > Set High Timeframe to "Chart"
3. Settings > Ensure "Use price as divisor" is checked.
It's recommended to use this indicator in higher timeframes. Buy and sell signals are displayed in real-time. However, waiting until 1/4 to 1/2 into the current bar is recommended before taking action, and change can happen.
The buy/sell signals (zones) provide recommendations on playing a long vs. a short. When in a buy sone, only play longs. When in a sell zone, only play shorts.
Then use the linear regression price channel oversold and undersold zones to optionally open and close positions within the buy/sell zones.
For example, consider opening a long in a buy zone when the linear regression price channel shows undersold. Then consider closing the long when the price moves into the linear regression oversold or higher. Then repeat as long as it's in the buy zone. Then vice versa for sell zones and shorting.
At basic design, buy in the buy zone, sell or short in the sell zone. If you are up for higher trading frequencies, use the linear regression price channel as described in the example above.
Please note, as, with all indicators, you may need to adjust to fit the indicator to your symbol and desired timeframe.
This is only an example of use. Please use this indicator as your own risk and after doing your due diligence.
Does the indicator include any alerts?
Yes,
"DB CFHLC3: Signal BUY" - Is triggered when a buy signal is fired.
"DB CFHLC3: Signal SELL" - Is triggered when a sell signal is fired.
"DB CFHLC3: Zone BUY" - Is triggered when a buy zone is detected.
"DB CFHLC3: Zeon SELL" - Is triggered when a sell zone is detected.
"DB CFHLC3: Oversold SELL" - Is triggered when the price exceeds the oversold level.
"DB CFHLC3: Undersold BUY" - Is triggered when the price goes below the undersold level.
Any other tips?
Once you have configured the indicator for your symbol and chart timeframe. Meaning the plots are displayed over the price. Check out larger timeframes such as W, 2W, 3W, 4W, M, and 4M. It works wonderfully for showing market lows and highs for long-term investing too!
Another, tip is to combine it with your favorite indicator, such as TTM Squeeze or MACD for confirmation purposes. You may be surprised how fast the indicator shows market direction changes on higher timeframes.
You can just as easily use a high timeframe such as D, 2D, or 3D for day trading due to how the linear price channel works.
Why am I not selling this indicator?
I would like to bless the TradingView community, and I enjoy publishing custom indicators.
If you enjoy this indicator, please consider leaving a thumbs up or a comment for others to know about your experience or recommendations.
Enjoy!
Annual Returns % Comparison [By MUQWISHI]Overview
The Annual Returns % Comparison indicator aimed to compare the historical annual percentage change of any two symbols. The indicator output shows a column-plot that was developed by two using a pine script table, so each period has pair columns showing the yearly percentage change for entered symbols.
Features
- Enter date range.
- Fill up with any two symbols.
- Choose the output data whether adjusted or not.
- Change the location of the table plot
- Color columns by a symbol.
- Size the height and width of columns.
- Color background, border, and text.
- The tooltip of the column value appears once the cursor sets above the specific column. As it seen below.
Let me know if you have any questions.
Thanks.

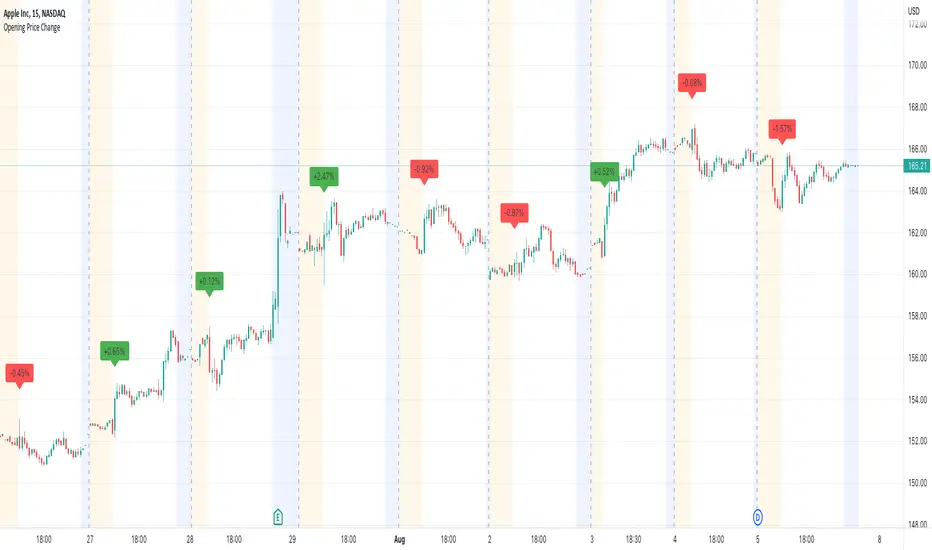
Opening Price ChangeThis script shows the change from the market opening price to the market closing price of the previous day in percent.
With this you can quickly get an overview of historical data for the change of the respective day.
Important: the market closing price is always used for the calculation and not the pre/post market price.
The label with the change value is always placed above the first opens regular market bar. If the change is positive, the label is draw with a green background, is the change is negative you will have a red background.
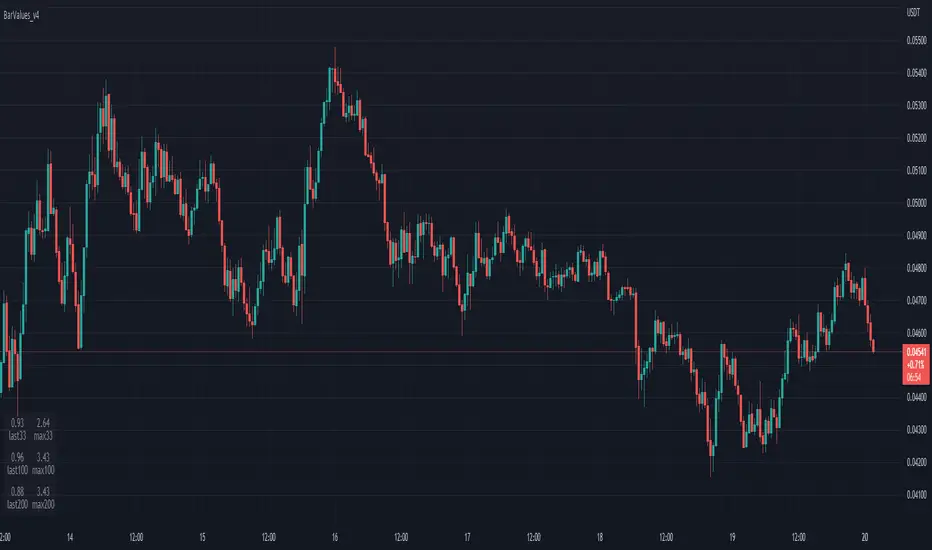
TableBarValues_v4It give you the absolute value of bar changes for different period of tims (33, 100, 200) AND the max barchange ont the same period.
Can be added in v4 in all codes. Stupid but useful.
You can add it to any v4 script. The location of the table can be changed easily
Inspired from the tradingview community. Don't forget to hydrate. @Magnumm
ToleranceThis indicator measures the Tolerance in the price, it works on all timeframes,
The main goal actually was to indicate the undefined trend zones like when the price is squeezed, the indicator value will be very close to zero (at this zone you should not place any orders)
But also the moving averages may give a good signals on the indicator, crossing up moving average indicate a long signal, you may need aid of other indicators to make sure this zone is long before going long in a bullish trap!

Daily MovesShow percent daily moves with a 5 period look back. This helps visualize recent performance.
Bitcoin Movement vs. Coin's Movement MTFThis script tracks the percent change of Bitcoin vs. the percent change of the coin on the chart. Crypto markets are usually affected greatly by Bitcoin swings so being able to see if the given coin is trending above or below Bitcoin is useful market data. All choices made with this script are your own! Thanks.

Signal Table - AutoFib - SMA - EMA - RSI - ATR - VolWith this indicator you can add a table on top of your chart.
What's in this table?
On which graph you open this table, the indicator data at the selected time of that graph are written. In the image below, you can see the table in the upper right.
You can also see two EMAs above the chart in this indicator. You can adjust their length.
You can add automatic fibonacci retracement levels to the top of the chart. In this way, you can see the Fibonacci levels on the chart and determine the support resistance. If the price is above the Fibonacci level, it will appear green on the chart, and red if below. You will understand as you use it.
It turns red if the RSI is below 30 and green if it is above 70.
Likewise, if the price is above the moving averages you have set, it appears as green, and if it is below it, it appears as red.
You can hide and activate the EMA and Fibonacci levels above the chart.
For example, you can get the ETH chart while the BTC chart is open in front of you. I think you will understand everything clearly from the settings tab below. Please support me. I hope you will be satisfied using it.

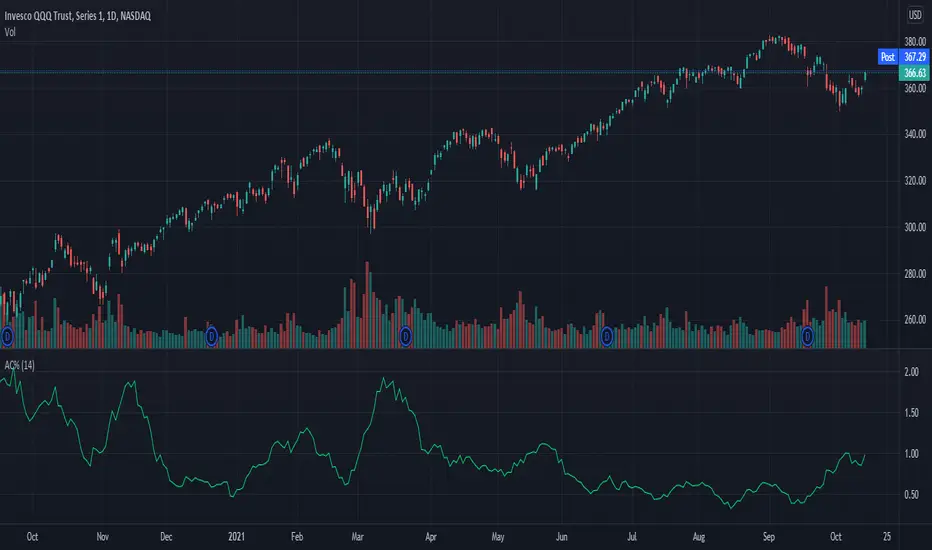
Average Change % (14-day)Simple script which calculates and shows the average change in a percentage format over a 14-day period.
Created due to the fact I couldn't find a percentage measure of average change when searching for it.
I have very little coding experience in Pine or otherwise so feel free to take and edit the script to make it a bit more user friendly.