INVITE-ONLY SCRIPT
已更新 Overreaction indicator
Overreaction Indicator (OI)
Class: overreaction indicator
Trading type: intraday trading
Time frame: 1 day
Purpose: momentum/contrarian trading
Level of aggressiveness: standard
Overreaction Indicator is designed for intraday trading purposes. The indicator is based on the Overreaction Hypothesis. According to this hypothesis, after an abnormally strong rise/fall in price, the next day the contrarian price movement follows.
There are statistically significant differences between intraday dynamics on days with abnormal price changes and normal days respectively.
There is a strong momentum effect on days with abnormal price changes, i.e. prices tend to change only in the direction of the abnormal price changes during the whole day; in addition, usually the presence of an abnormal price movements becomes clear at the start of the US trading session.
During the Asian trading session a strong contrarian pattern is present (i.e., on the day after the overreaction prices tend to go in the opposite direction). Contrarian movement is limited in time, since usually it lasts only till the start of the European session.
There exist trading strategies that generate abnormal profits by exploiting the detected anomalies.
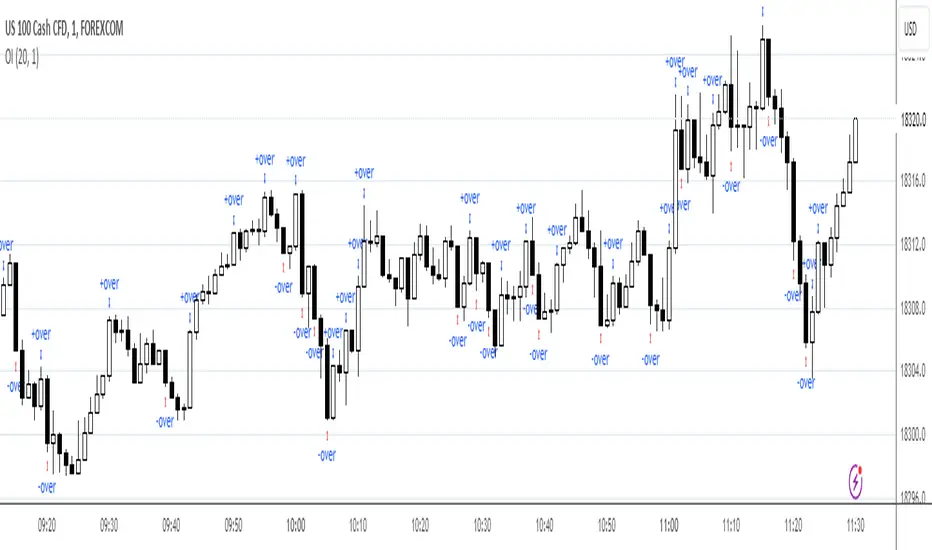
This indicator applies a dynamic trigger approach to detect daily abnormal price changes.
The indicator displays moments of market overreaction directly on the chart.
Parameters of the indicator
1. Averaging period (default value = 20) - period of indicator. It is used to define normal returns.
2. Number of Sigmas (number of standard deviations, default = 2) - Is used to detect abnormal returns. It defines levels of aggressiveness in trading signals. The bigger the value is the more conservative signals are generated
For the further information including the access to the indicator, please write in PM (private messages).
發行說明
Overreaction Indicator (OI)Class: overreaction indicator
Trading type: intraday trading
Time frame: 1 day
Purpose: momentum/contrarian trading
Level of aggressiveness: standard
Overreaction Indicator is designed for intraday trading purposes. The indicator is based on the Overreaction Hypothesis. According to this hypothesis, after an abnormally strong rise/fall in price, the next day the contrarian price movement follows.
There are statistically significant differences between intraday dynamics on days with abnormal price changes and normal days respectively.
There is a strong momentum effect on days with abnormal price changes, i.e. prices tend to change only in the direction of the abnormal price changes during the whole day; in addition, usually the presence of an abnormal price movements becomes clear at the start of the US trading session.
During the Asian trading session a strong contrarian pattern is present (i.e., on the day after the overreaction prices tend to go in the opposite direction). Contrarian movement is limited in time, since usually it lasts only till the start of the European session.
There exist trading strategies that generate abnormal profits by exploiting the detected anomalies.
This indicator applies a dynamic trigger approach to detect daily abnormal price changes.
The indicator displays moments of market overreaction directly on the chart.
Parameters of the indicator
1. Averaging period (default value = 20) - period of indicator. It is used to define normal returns.
2. Number of Sigmas (number of standard deviations, default = 2) - Is used to detect abnormal returns. It defines levels of aggressiveness in trading signals. The bigger the value is the more conservative signals are generated
Access to the indicator
Please address all questions about this indicator (including access to it) in private messages.
Авторские индикаторы
bit.ly/2oBvkHY
Больше информации на нашем ютьюб-канале
youtube.com/channel/UCYEOurJfasXWyYnrriGwsqQ
bit.ly/2oBvkHY
Больше информации на нашем ютьюб-канале
youtube.com/channel/UCYEOurJfasXWyYnrriGwsqQ
免責聲明
這些資訊和出版物並非旨在提供,也不構成TradingView提供或認可的任何形式的財務、投資、交易或其他類型的建議或推薦。請閱讀使用條款以了解更多資訊。