INVITE-ONLY SCRIPT
(9) Count Closing Score & Long Tails VS-222
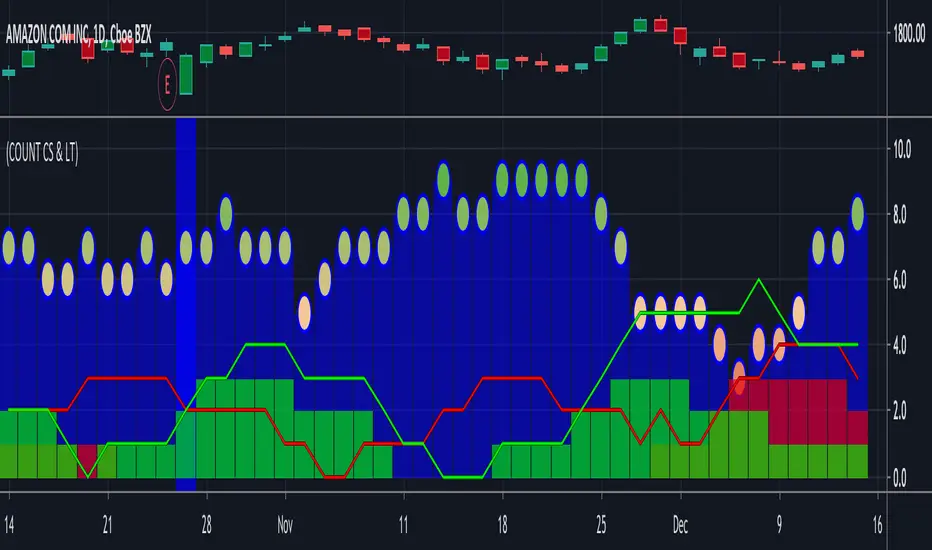
This indicator simply determines if the relationship of the close was close to the High or the Low of the day and provides you with a ten day running total. You are allowed to adjust what the actual proximity of the extreme parameters must be in order to be counted. The default is 10 for the low and 90 for the high.
This indicator takes a ten day cumulative look at the Closing Scores, close to the low shown in red. The Closing Score's close to the high, show in green and finally the ten day count of the occurrence of long tails. Since this is calculated over a 10 day period of time, the scale is between 0 and 10.
Here again, you have an additional tool that provides you with the current sentiment, but just as importantly, how that sentiment is transitioning over time.
The blue columns indicate trading days that produced long tails and again provides you with a ten day running total. Because most institutional and all program trades are designed to be executed with a specific price range, when retail traders' orders are filled outside of these parameters the only orders remaining to fuel the market are orders who's prices are bracketed and thus will revert the trading range back into this channel producing a long tail in those trading days. Of course, there are other circumstances that can cause long tails, but when you see a series of days that all have long tails and the price trend is not changing dramatically combined with approximately equal trading volume for those days, you are in all probability seeing institutional and / or programed trades. You want to see this indicator above 8 before it is meaningful in my experience.
This is a very good thing to see if you are looking for stocks about to make a dramatic move and more often than not it will be to the upside.
Access this Genie indicator for your Tradingview account, through our web site. (Links Below) This will provide you with additional educational information and reference articles, videos, input and setting options and trading strategies this indicator excels in.
僅限邀請腳本
只有經作者批准的使用者才能訪問此腳本。您需要申請並獲得使用權限。該權限通常在付款後授予。如欲了解更多詳情,請依照以下作者的說明操作,或直接聯絡StockSwinger。
除非您完全信任其作者並了解腳本的工作原理,否則TradingView不建議您付費或使用腳本。您也可以在我們的社群腳本中找到免費的開源替代方案。
作者的說明
免責聲明
這些資訊和出版物並不意味著也不構成TradingView提供或認可的金融、投資、交易或其他類型的意見或建議。請在使用條款閱讀更多資訊。
僅限邀請腳本
只有經作者批准的使用者才能訪問此腳本。您需要申請並獲得使用權限。該權限通常在付款後授予。如欲了解更多詳情,請依照以下作者的說明操作,或直接聯絡StockSwinger。
除非您完全信任其作者並了解腳本的工作原理,否則TradingView不建議您付費或使用腳本。您也可以在我們的社群腳本中找到免費的開源替代方案。
作者的說明
免責聲明
這些資訊和出版物並不意味著也不構成TradingView提供或認可的金融、投資、交易或其他類型的意見或建議。請在使用條款閱讀更多資訊。