INVITE-ONLY SCRIPT
已更新 Statistical Trend Length Analysis (Quant indicator)
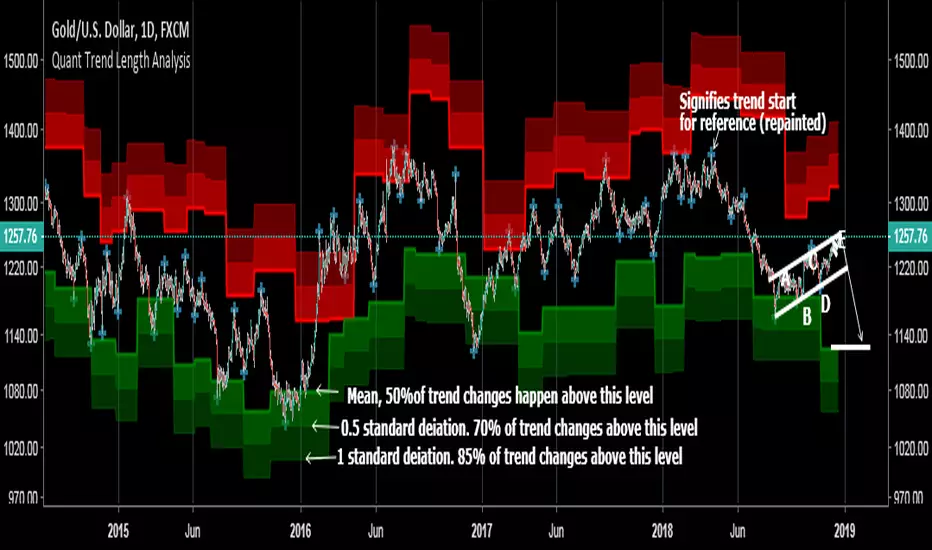
This is the only Quantitative type indicator I can find on TradingView (which means it uses automated back testing to determine probability in a mathematical way), although there could be some I just haven't seen them.
This indicator back-tests ALL of the data, calculates the length of all past trends, and does a statistical analysis of trend changes at different levels. The more recent data is more accurate as it learns as the indicator goes along.
These levels can be used in regression to the mean trading, as it gives you an idea of the statistical likeliness of a trend change or pullback occurring in each zone. An average trend length is a very good point to enter when trading a pullback within a trend, although without a complex analysis like this it would be impossible to determine where that is.
PM me for access, and more details on strategies that can be implemented using this indicator.
發行說明
fixed a tradingview update bug僅限邀請腳本
僅作者批准的使用者才能訪問此腳本。您需要申請並獲得使用許可,通常需在付款後才能取得。更多詳情,請依照作者以下的指示操作,或直接聯絡JamesRkaye。
TradingView不建議在未完全信任作者並了解其運作方式的情況下購買或使用腳本。您也可以在我們的社群腳本中找到免費的開源替代方案。
作者的說明
免責聲明
這些資訊和出版物並非旨在提供,也不構成TradingView提供或認可的任何形式的財務、投資、交易或其他類型的建議或推薦。請閱讀使用條款以了解更多資訊。
僅限邀請腳本
僅作者批准的使用者才能訪問此腳本。您需要申請並獲得使用許可,通常需在付款後才能取得。更多詳情,請依照作者以下的指示操作,或直接聯絡JamesRkaye。
TradingView不建議在未完全信任作者並了解其運作方式的情況下購買或使用腳本。您也可以在我們的社群腳本中找到免費的開源替代方案。
作者的說明
免責聲明
這些資訊和出版物並非旨在提供,也不構成TradingView提供或認可的任何形式的財務、投資、交易或其他類型的建議或推薦。請閱讀使用條款以了解更多資訊。