OPEN-SOURCE SCRIPT
Normalized Volume Z-Score
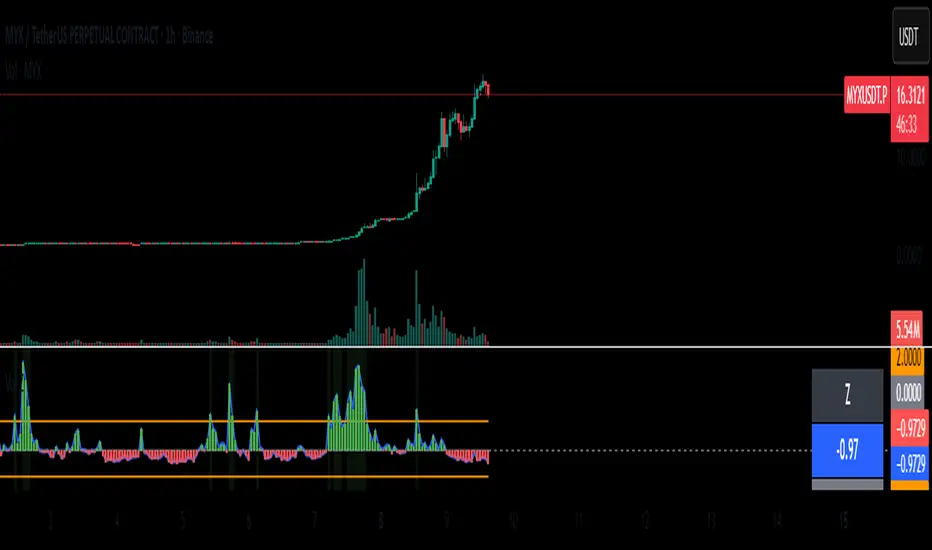
The Normalized Volume Z-Score indicator measures how unusual the current trading volume is compared to its recent history.
It calculates the z-score of volume over a user-defined lookback period (default: 50 bars), optionally using log-volume normalization.
A z-score tells you how many standard deviations today’s volume is away from its mean:
Z = 0 → volume is at its average.
Z > 0 → volume is higher than average.
Z < 0 → volume is lower than average.
Threshold lines (±2 by default) highlight extreme deviations, which often signal unusual market activity.
How to Trade with It
High positive Z-score (> +2):
Indicates abnormally high volume. This often happens during breakouts, strong trend continuations, or capitulation events.
→ Traders may look for confirmation from price action (e.g., breakout candle, strong trend bar) before entering a trade.
High negative Z-score (< –2):
Indicates unusually low volume. This may signal lack of interest, consolidation, or exhaustion.
→ Traders may avoid entering new positions during these periods or expect potential reversals once volume returns.
Cross back inside thresholds:
When z-score returns inside ±2 after an extreme spike, it may suggest that the abnormal activity has cooled down.
Tips
Works best when combined with price structure (support/resistance, demand/supply zones).
Can be applied to crypto, stocks, forex, futures – anywhere volume is meaningful.
Log normalization helps reduce distortion when some days have extremely large volumes.
開源腳本
秉持TradingView一貫精神,這個腳本的創作者將其設為開源,以便交易者檢視並驗證其功能。向作者致敬!您可以免費使用此腳本,但請注意,重新發佈代碼需遵守我們的社群規範。
免責聲明
這些資訊和出版物並非旨在提供,也不構成TradingView提供或認可的任何形式的財務、投資、交易或其他類型的建議或推薦。請閱讀使用條款以了解更多資訊。
開源腳本
秉持TradingView一貫精神,這個腳本的創作者將其設為開源,以便交易者檢視並驗證其功能。向作者致敬!您可以免費使用此腳本,但請注意,重新發佈代碼需遵守我們的社群規範。
免責聲明
這些資訊和出版物並非旨在提供,也不構成TradingView提供或認可的任何形式的財務、投資、交易或其他類型的建議或推薦。請閱讀使用條款以了解更多資訊。