OPEN-SOURCE SCRIPT
已更新 Bulls vs Bears
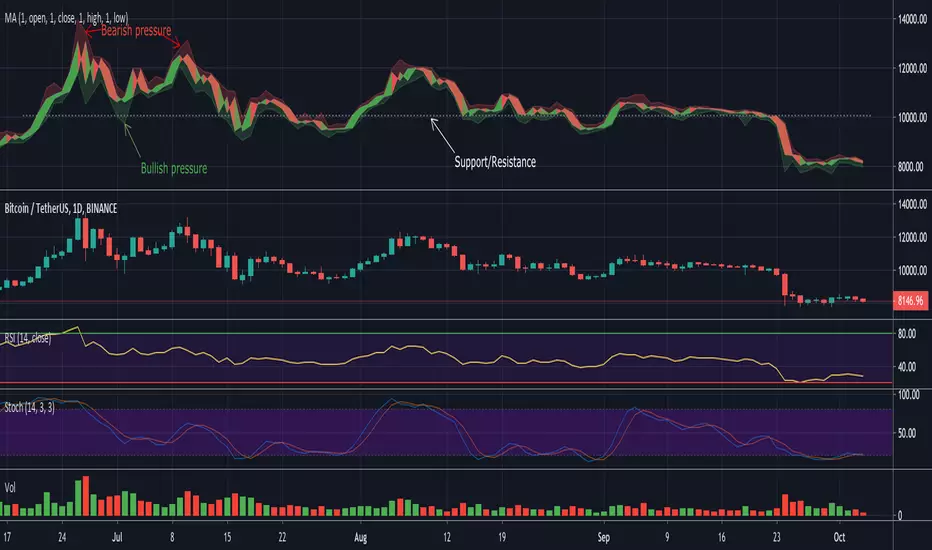
A tool with the purpose for better insight of bulls/bears influence.
The center, more bright part are the open-close prices, filled green if bullish, red if bearish.
The transparent red and green part, above and below, are the "wick/shadow" area's.
If for example the bears push the price down, far under the open, but the bulls push it right back, so you'll have a large wick,
this will be visible as a large transparent green area below the brighter open-close center area.
Hope this helps!
發行說明
Also it might help to find certain support/resistance regions (more towards the open/close prices),it also can give a more clear imagine when the open and close prices are tight together.
I believe it even can bring more insights and more details regarding divergences.
開源腳本
秉持TradingView一貫精神,這個腳本的創作者將其設為開源,以便交易者檢視並驗證其功能。向作者致敬!您可以免費使用此腳本,但請注意,重新發佈代碼需遵守我們的社群規範。
Who are PineCoders?
tradingview.com/chart/SSP/yW5eOqtm-Who-are-PineCoders/
TG Pine Script® Q&A: t.me/PineCodersQA
- We cannot control our emotions,
but we can control our keyboard -
tradingview.com/chart/SSP/yW5eOqtm-Who-are-PineCoders/
TG Pine Script® Q&A: t.me/PineCodersQA
- We cannot control our emotions,
but we can control our keyboard -
免責聲明
這些資訊和出版物並非旨在提供,也不構成TradingView提供或認可的任何形式的財務、投資、交易或其他類型的建議或推薦。請閱讀使用條款以了解更多資訊。