INVITE-ONLY SCRIPT
已更新 Crodl Auto Trader
I've added Buy & Sell Flags - They will be used to add Longs and Shorts Flags as well as the ability to add alerts on them.
What triggers the Buy signal?
Buy signal = This indicator make use of the rsi (Relative Strength Index) to look at specific overbought and oversold levels as confirmation if it is an uptrend and not overbought yet. This will indicate that a long opportunity will be possible.
The SMA (slow moving average) is being used to calculate where to entry as it uses Crossed SMA's for entries.
SMA and EMA Crosses with the RSI (not overbought) will give as a buy signal if the SMA cross the EMA.
Sell signal = When the Rsi is not oversold this will give a good confirmation that the market still has downwards potential and it will wait for a cross on the SMA and EMA when crossed over for a sell signal. If we get a cross but the RSI is oversold that will be seen as a bad signal and it will be avoided.
Take Profit - Currently there are 4 Hardcoded Targets and on the backtester you will see the results for all 4 separately on the Info Panel.
The 4 green lines (TP)
1st line is at 0.5% market move, 2nd line is at 1% market move ,3rd one is at 1.5% market move and the last and 4th line is at 2%.
This will be where it will take profit unless you set the Exit Strategy to Opposite then it will use the opposite flags to exit.
So when it is set to Opposite and the previous flag was a long then it will exit on the next short flag and when the previous flag was a short flag then it will exit on the next long flag.
if the exit strategy is set to CrodlExit it will use an ATR based exit. so if the previous flag was a short it will wait for price to cross an ATR level then it will close the short and the same if the last flag was a long it will only be closed if a TP (green line) level has been reached or the ATR level for an exit.
if the Exit Strategy has been set to Fixed SL then you can set the sl at a specific %. if you set the Fixed SL at 2% that means if the last flag was a buy signal then if the TP targets was not reached first and the market moves downwards by 2% it will exit and wait for the next flag, if you are in a short and the TP level was not reached if the market moves 2% upwards it will close your short.
Backtest Data has 3 options. You can choose for it to show both Long(Buy) and short(sell) or just Buy or just Sell data.
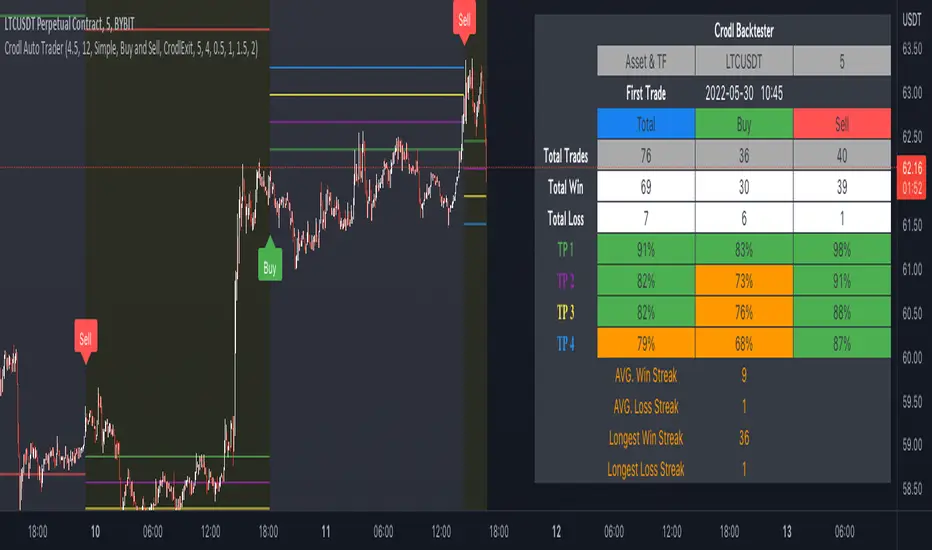
Statistics Type will show you the info panel on the right. if you set it on Simple you will see the following data
Asset that you are currently on as well as the timeframe.
and the date it starts reading data to plot entries from. this will change depending on the timeframe that you are on. since higher timeframes will show you candles from longer time back as lower time frames.
Total = The amount of buy and sell flags since the first trade data and buy will give you the buy amount flags shown since that date and sell will show you the amount of sell flags since the start date.
Total win = this will tell you how many trades reached the TP (green lines) before a exit condition was met.
Total loss = this will show you how many of the flags exited based on the exit type selected before a TP target was reached.
TP1= how many time we reached the first target level at 0.5%
TP2= how many time we reached the second target level at 1.0%
TP3= how many time we reached the third target level at 1.5%
TP4= how many time we reached the fourth target level at 2.0%
the % are calculated from the total wins and total losses and it will give you the % difference.
If the % is bigger than 80 it will have a green background and if its less than 80% but more than 50% then it will be orange, if it is less than 50% it will be red.
win streak is the average of how many times we reached the profit target in a row before we reached an exit target based on the exit strategy
Loss streak is the average of how Many losses we had in a row before we reached the TP1 level
Longest Winning streak is how many times after one win we had another wining trade meaning TP reached before a stop level based on the exit strategy
Longest losing streak is the amount of times we reached the SL level based on the exit strategy before reaching a TP level or the opposite flag depending on the setting based on exit strategy.
to hide the info panel you can set the statistics to Coming soon.
Alerts can be set on all the TP targets and Entries(Buy and Sell flag) as well as all the exit strategies.
What triggers the Buy signal?
Buy signal = This indicator make use of the rsi (Relative Strength Index) to look at specific overbought and oversold levels as confirmation if it is an uptrend and not overbought yet. This will indicate that a long opportunity will be possible.
The SMA (slow moving average) is being used to calculate where to entry as it uses Crossed SMA's for entries.
SMA and EMA Crosses with the RSI (not overbought) will give as a buy signal if the SMA cross the EMA.
Sell signal = When the Rsi is not oversold this will give a good confirmation that the market still has downwards potential and it will wait for a cross on the SMA and EMA when crossed over for a sell signal. If we get a cross but the RSI is oversold that will be seen as a bad signal and it will be avoided.
Take Profit - Currently there are 4 Hardcoded Targets and on the backtester you will see the results for all 4 separately on the Info Panel.
The 4 green lines (TP)
1st line is at 0.5% market move, 2nd line is at 1% market move ,3rd one is at 1.5% market move and the last and 4th line is at 2%.
This will be where it will take profit unless you set the Exit Strategy to Opposite then it will use the opposite flags to exit.
So when it is set to Opposite and the previous flag was a long then it will exit on the next short flag and when the previous flag was a short flag then it will exit on the next long flag.
if the exit strategy is set to CrodlExit it will use an ATR based exit. so if the previous flag was a short it will wait for price to cross an ATR level then it will close the short and the same if the last flag was a long it will only be closed if a TP (green line) level has been reached or the ATR level for an exit.
if the Exit Strategy has been set to Fixed SL then you can set the sl at a specific %. if you set the Fixed SL at 2% that means if the last flag was a buy signal then if the TP targets was not reached first and the market moves downwards by 2% it will exit and wait for the next flag, if you are in a short and the TP level was not reached if the market moves 2% upwards it will close your short.
Backtest Data has 3 options. You can choose for it to show both Long(Buy) and short(sell) or just Buy or just Sell data.
Statistics Type will show you the info panel on the right. if you set it on Simple you will see the following data
Asset that you are currently on as well as the timeframe.
and the date it starts reading data to plot entries from. this will change depending on the timeframe that you are on. since higher timeframes will show you candles from longer time back as lower time frames.
Total = The amount of buy and sell flags since the first trade data and buy will give you the buy amount flags shown since that date and sell will show you the amount of sell flags since the start date.
Total win = this will tell you how many trades reached the TP (green lines) before a exit condition was met.
Total loss = this will show you how many of the flags exited based on the exit type selected before a TP target was reached.
TP1= how many time we reached the first target level at 0.5%
TP2= how many time we reached the second target level at 1.0%
TP3= how many time we reached the third target level at 1.5%
TP4= how many time we reached the fourth target level at 2.0%
the % are calculated from the total wins and total losses and it will give you the % difference.
If the % is bigger than 80 it will have a green background and if its less than 80% but more than 50% then it will be orange, if it is less than 50% it will be red.
win streak is the average of how many times we reached the profit target in a row before we reached an exit target based on the exit strategy
Loss streak is the average of how Many losses we had in a row before we reached the TP1 level
Longest Winning streak is how many times after one win we had another wining trade meaning TP reached before a stop level based on the exit strategy
Longest losing streak is the amount of times we reached the SL level based on the exit strategy before reaching a TP level or the opposite flag depending on the setting based on exit strategy.
to hide the info panel you can set the statistics to Coming soon.
Alerts can be set on all the TP targets and Entries(Buy and Sell flag) as well as all the exit strategies.
發行說明
Fixed alert condition errors發行說明
Added Alerts to Buy and Sell Signal發行說明
Alerts Conditions Updated For Fixed Stop Loss and TP 1 ,TP 2,TP 3 and TP 4.發行說明
Alert Messages Update.發行說明
Alerts set so that they will fire only once per signal, meaning if long tp will fire once only. Tp 2 ,3 and 4 as well and will wait for next flag to activate again.發行說明
Crodlexit added as a visual and Alert Fixed發行說明
Updated Default Inputs發行說明
Longs & Short Adjusted with Alert-conditions 發行說明
Background Updated發行說明
Updated TP targetsadded entries as visual = default is set to None so enable it in Style
發行說明
Take Profits are now adjustable.Mobile Backtester Mode and Hide mode added
免責聲明
這些資訊和出版物並不意味著也不構成TradingView提供或認可的金融、投資、交易或其他類型的意見或建議。請在使用條款閱讀更多資訊。