OPEN-SOURCE SCRIPT
已更新 Footprint strategy
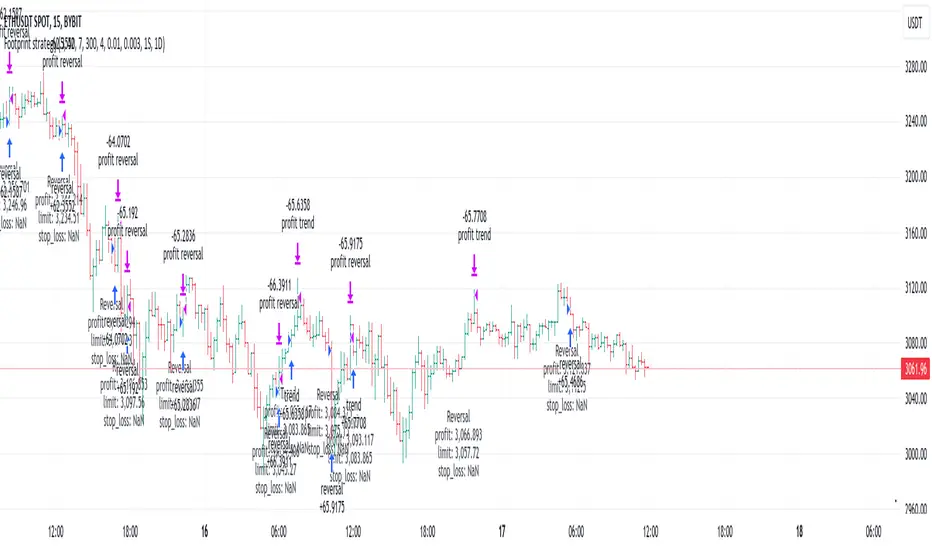
This strategy uses imbalance volume data obtained by footprint calculation technology.
There are two signals to enter a trade:
When any of the conditions is triggered, two orders are placed: Take Profit and Stop loss (according to the percentage value from the inputs).
A little advice on use:
Inputs related to the strategy:
Inputs related to the calculation of footprints (collection of the volume of purchases and sales):
If you have suggestions for improving the strategy and adding new conditions for entering and exiting the trade, please write).
There are two signals to enter a trade:
- trend - the current buy volume on the bar is greater than the current sell volume and there is at least one imbalance line.
- reversal - the current bar is falling, but the general market trend is positive (growing) and the imbalance buy volume exceeds the imbalance sell volume.
When any of the conditions is triggered, two orders are placed: Take Profit and Stop loss (according to the percentage value from the inputs).
A little advice on use:
- The strategy performs best on a 15 minute timeframe.
- It is necessary to choose acceptable values of Take Profit and Stop loss depending on the order of symbol prices.
Inputs related to the strategy:
- Stop loss - percentage size of stop loss to exit the trade.
- Enable stop loss - stop loss activation.
- Take Profit - percentage size of Take Profit.
- Calculation timeframe - this is the timeframe from which the volume will be collected for distribution to buy and sell (if you do not have access to the seconds chart, set here 1 minute, the accuracy will be less, but it will work).
- Trend timeframe - this is the timeframe from which the trend will be calculated.
- Enable trend - activation of trend calculation.
Inputs related to the calculation of footprints (collection of the volume of purchases and sales):
- Count show bars - Number of bars from rt bar to history to calculate.
- Display all available bars - Strategy calculation on all available bars (based on the available amount of data with reduced resolution (set in Calculation timeframe)).
- Ticks Per Row - Sets the price step, calculated by multiplying the entered value by syminfo.mintick.
- Auto - The automatic "Ticks Per Row" calculation is based on the first available bar and applied to subsequent bars.
- Max row - sets the acceptable number of rows within a bar.
- Imbalance Percent - A percentage coefficient to determine the Imbalance of price levels.
- Stacked levels - And minimum number of consecutive Imbalance levels required to draw extended lines.
If you have suggestions for improving the strategy and adding new conditions for entering and exiting the trade, please write).
發行說明
minor fix開源腳本
秉持TradingView一貫精神,這個腳本的創作者將其設為開源,以便交易者檢視並驗證其功能。向作者致敬!您可以免費使用此腳本,但請注意,重新發佈代碼需遵守我們的社群規範。
免責聲明
這些資訊和出版物並非旨在提供,也不構成TradingView提供或認可的任何形式的財務、投資、交易或其他類型的建議或推薦。請閱讀使用條款以了解更多資訊。
開源腳本
秉持TradingView一貫精神,這個腳本的創作者將其設為開源,以便交易者檢視並驗證其功能。向作者致敬!您可以免費使用此腳本,但請注意,重新發佈代碼需遵守我們的社群規範。
免責聲明
這些資訊和出版物並非旨在提供,也不構成TradingView提供或認可的任何形式的財務、投資、交易或其他類型的建議或推薦。請閱讀使用條款以了解更多資訊。