The following script is an original creation originally posted on the blog section of the broker Alpaca.
The proposed indicator aims to measure the degree of variations of individual up-trends and down-trends in the price, thus allowing to highlight the direction and amplitude of a current trend.
Settings
Usage

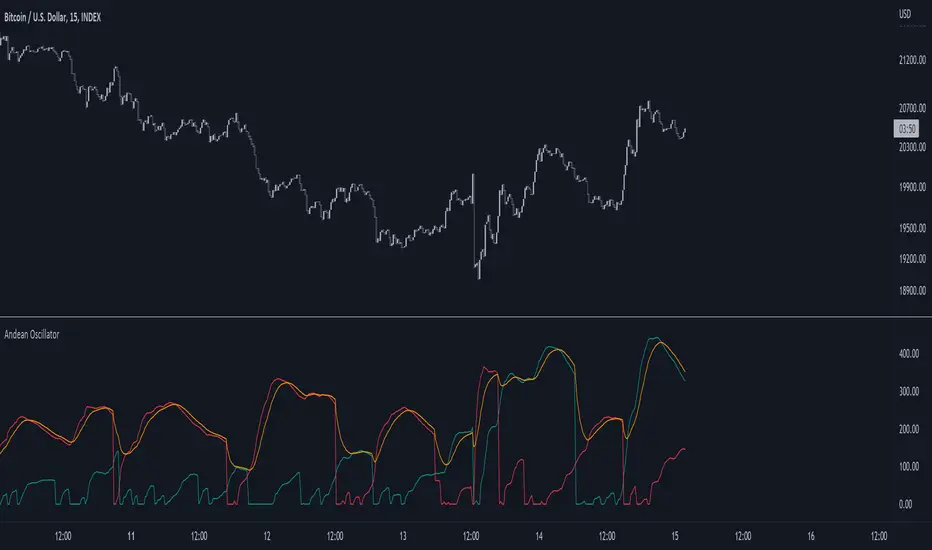
The Andean Oscillator can return multiple information to the user, with its core interpretation revolving around the bull and bear components.
A rising bull component (in green) indicates the presence of bullish price variations while a rising bear component (in red) indicates the presence of bearish price variations.
When the bull component is over the bear component market is up-trending, and the user can expect new higher highs. When the bear component is over the bull component market is down-trending, and the user can expect new lower lows.
The signal line (in orange) allows a more developed interpretation of the indicator and can be used in several ways.
It is possible to use it to filter out potential false signals given by the crosses between the bullish and bearish components. As such the user might want to enter a position once the bullish or bearish component crosses over the signal line instead.
Details
Measuring the degree of variations of trends in the price by their direction (up-trend/down-trend) can be done in several way.
The approach taken by the proposed indicator makes use of exponential envelopes and the naive computation of standard deviation.
First, exponential envelopes are obtained from both the regular prices and squared prices, thus giving two upper extremities, and two lower extremities.
The bullish component is obtained by first subtracting the upper extremity of the squared prices with the squared upper extremity of regular prices, the square root is then applied to this result.
The bearish component is obtained in the same way, but makes use of the lower extremities of the exponential envelopes.
The proposed indicator aims to measure the degree of variations of individual up-trends and down-trends in the price, thus allowing to highlight the direction and amplitude of a current trend.
Settings
- Length : Determines the significance of the trends degree of variations measured by the indicator.
- Signal Length : Moving average period of the signal line.
Usage
The Andean Oscillator can return multiple information to the user, with its core interpretation revolving around the bull and bear components.
A rising bull component (in green) indicates the presence of bullish price variations while a rising bear component (in red) indicates the presence of bearish price variations.
When the bull component is over the bear component market is up-trending, and the user can expect new higher highs. When the bear component is over the bull component market is down-trending, and the user can expect new lower lows.
The signal line (in orange) allows a more developed interpretation of the indicator and can be used in several ways.
It is possible to use it to filter out potential false signals given by the crosses between the bullish and bearish components. As such the user might want to enter a position once the bullish or bearish component crosses over the signal line instead.
Details
Measuring the degree of variations of trends in the price by their direction (up-trend/down-trend) can be done in several way.
The approach taken by the proposed indicator makes use of exponential envelopes and the naive computation of standard deviation.
First, exponential envelopes are obtained from both the regular prices and squared prices, thus giving two upper extremities, and two lower extremities.
The bullish component is obtained by first subtracting the upper extremity of the squared prices with the squared upper extremity of regular prices, the square root is then applied to this result.
The bearish component is obtained in the same way, but makes use of the lower extremities of the exponential envelopes.
開源腳本
秉持TradingView一貫精神,這個腳本的創作者將其設為開源,以便交易者檢視並驗證其功能。向作者致敬!您可以免費使用此腳本,但請注意,重新發佈代碼需遵守我們的社群規範。
Check out the indicators we are making at luxalgo: tradingview.com/u/LuxAlgo/
"My heart is so loud that I can't hear the fireworks"
"My heart is so loud that I can't hear the fireworks"
免責聲明
這些資訊和出版物並非旨在提供,也不構成TradingView提供或認可的任何形式的財務、投資、交易或其他類型的建議或推薦。請閱讀使用條款以了解更多資訊。